

 Conviva Leadership

Blog

Today, the return on investment in streaming advertising isn’t often fully understood. Take product placement, for example. How many viewers, on what types of devices, with what mix of demographics, in what geographies, saw your brand highlighted in the storyline of the latest streaming blockbuster? And what actions did the individuals take after seeing your product placement in the stream?
Learning the answers to these questions (and a few others we’ll explore) is truly an engineering feat that requires capturing the accurate Playhead Time (PHT) of a video from many players at global scale and linking that data with identity.
PHT is the pointer representing the exact moment in a video’s play span that is currently being watched by the user. We represent that using time in milliseconds from the beginning of the video content.
Data complexity
While PHT may seem straightforward, it can be reported differently on different devices, players, and platforms. Players also report unique video events, such as video start, seeking, buffering, ad start, ad end, and video end as well as different video types reported like live, on-demand, and DVR.
User behavior further complicates data collection. Viewers can watch pre-roll, mid-roll, or post-roll ads, all of which need to be reported differently. On players that don’t allow viewers to skip ads, when a viewer does attempt to skip an ad, the PHT can be affected. Seeking or rewinding content, one ad, and multiple ads, as well as pausing due to a user action or buffering are even more possible behaviors and—you guessed it—need to be collected and reported separately.
Because the Conviva Stream Sensor is the constant, deployed across many different types of video players, we capture, clean, and standardize this data in a more consistent, accurate way. PHT data is collected from the player through periodic heartbeat messages with millisecond accuracy when important video events occur.
Data analyzation and verification at scale
Let’s take a look at how to analyze PHT.
We use the Databricks technology stack to analyze, sanitize, store, and process PHT from billions of streaming devices that have the Conviva Stream Sensor deployed.
With this stack, we can:
- Analyze Playhead Time coverage and data accuracy for all players all publishers.
- Analyze the diversity of user behavior that match to the Playhead Time
- Understand the Playhead Time offset caused by ad play
- Implement PHT adjustment algorithms
- Verify the adjusted PHT data
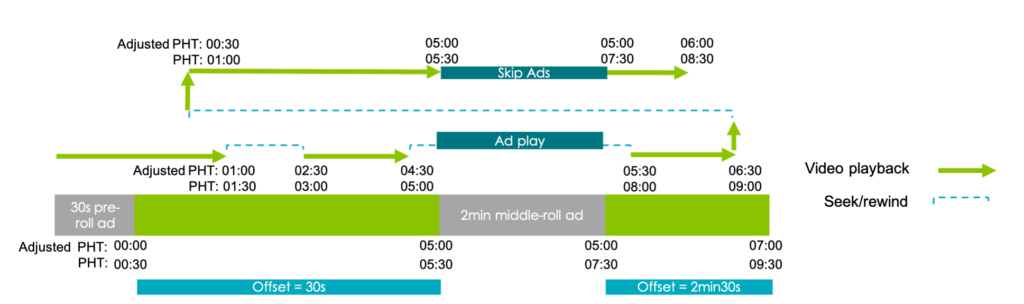
In this real-world example, there is a 30-second pre-roll ad and two-minute mid-roll ad. The user tried to seek past the mid-roll ad, but couldn’t, so the PHT moved back to where the ad began. After the ad, the player skipped to the part of the video the user wanted to watch. This means that the PHT that is reported isn’t totally accurate and needs to be adjusted; we must run an adjustment algorithm to determine the true PHT.
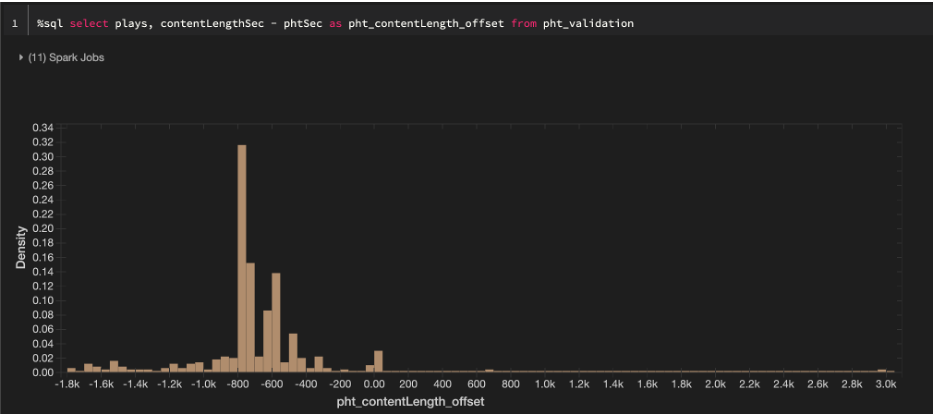
But how do we validate adjusted PHT, and more importantly, how do we know when player behavior and backend processing go out-of-sync resulting in incorrect adjusted PHT data? For each piece of content, we calculate the offset between content length, which can be provided by a publisher or inferred by the playback time, and the max PHT, then plot the distribution for all content.
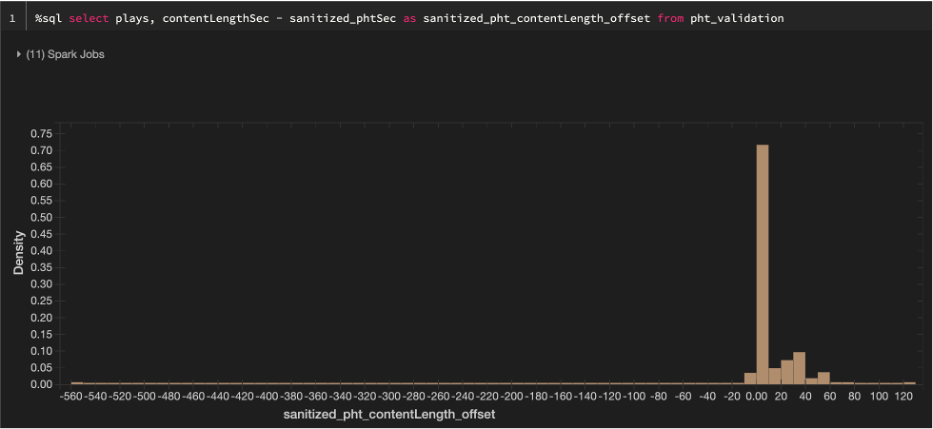
The standard deviation of the adjusted PHT distribution is smaller than the original PHT, which proves the PHT adjusting algorithm is accurate.
Original PHT
Adjusted PHT
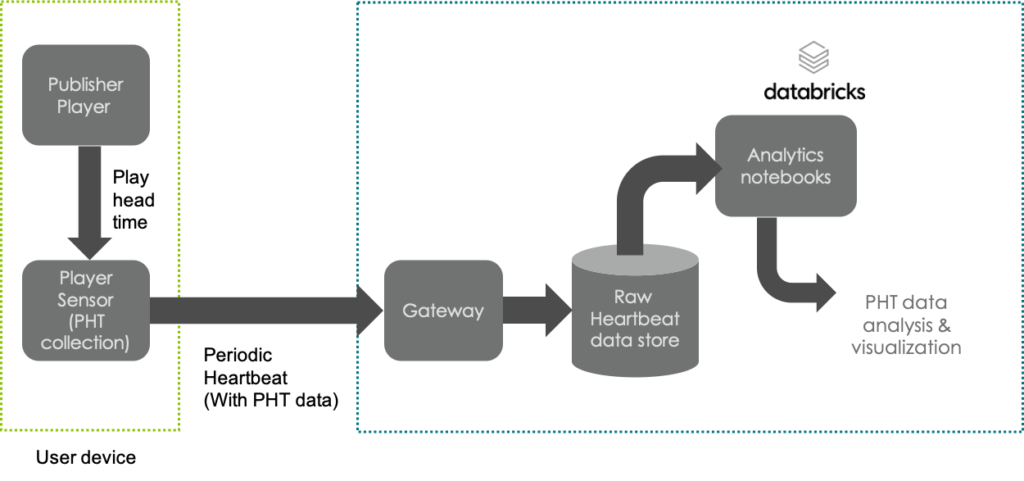
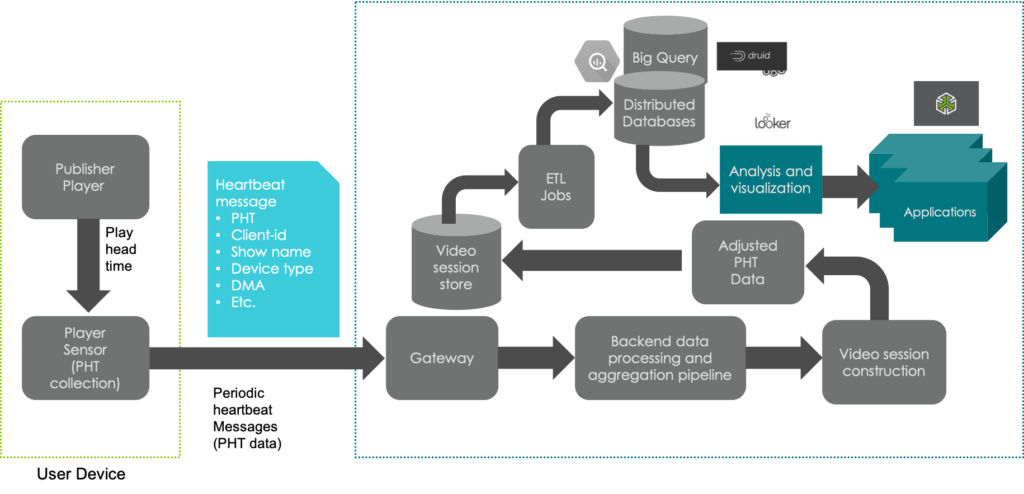
Here’s the Conviva PHT processing and application pipeline. Our Stream Sensor collects PHT data and periodically sends the heartbeat packages into Conviva Gateway. Our backend will construct the raw heartbeat packages into video session data, then calculate the adjusted PHT. After a few extract, transform, load (ETL) jobs, the adjusted PHT data will be stored in distributed databases and visualized in applications.
Data enrichment
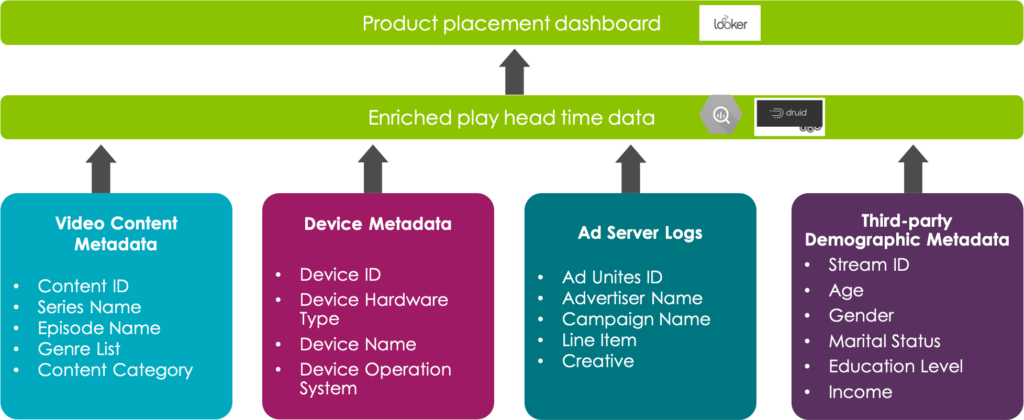
PHT is useful to understand by itself, but to really learn how PHT affects advertising, we need to enrich the data. Our Stream Sensor collects granular video content and device metadata that can be used to add more context to the viewer experience, including the genre and category of the content as well as the device type and operating system. By ingesting ad server logs, we can add additional context with everything from advertiser name to the actual creative watched. When added with third-party demographic metadata, we can see a full picture of the type of person who watched the content and ads. We can then visualize this data to understand the whole viewer journey.
In our product placement example, you can look at viewer content engagement (did viewers skip or rewatch any of the content with your product?) and ad performance impact (did viewers abandon the content because an ad took too long to load?).
Product placement isn’t the only use case for this type of analysis.
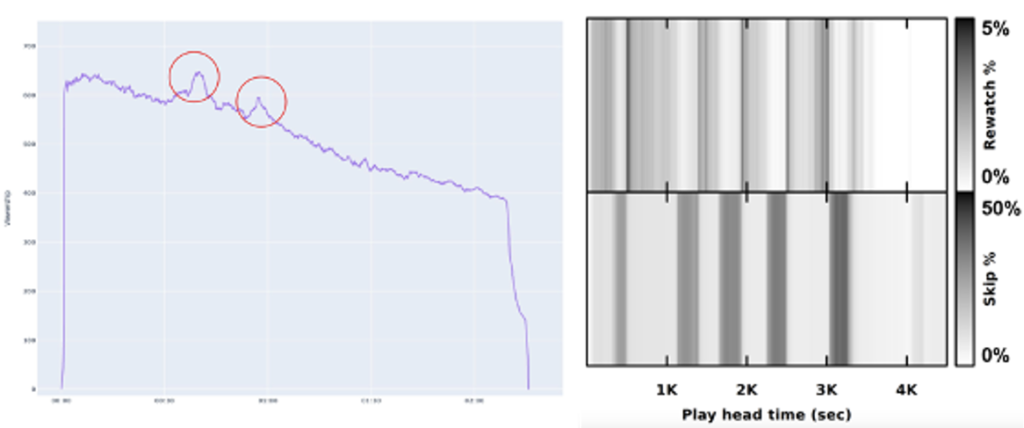
Viewer content engagement analysis records how viewers engage with publisher videos by identifying parts of a video that they re-watch, pause, and skip to track what point in the video most viewers are dropping off. In this example, you can see that a movie has two very iconic scenes. These two scenes correspond to two peaks of this curve at 40 minutes and 57 minutes, but we can also see what parts of the movie viewers liked less or skipped over. This type of analysis helps content teams understand the perceived “good” and “bad” sections of their content and tech ops teams determine if there might be quality of experience (QoE) issues within the content.
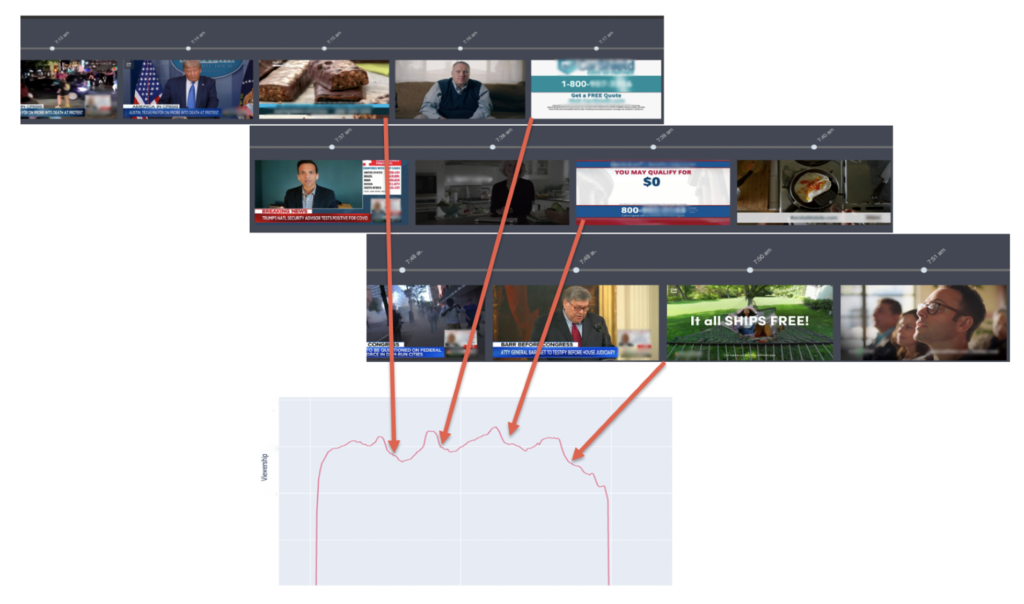
Another use case is seeing how ad placement that is mismatched with content causes viewers to abandon the ad or content, which means that the publisher’s brand loyalty is impacted and advertisers lose money.
PHT-level analytics help detect these impacts and knowing the impact ads have on content engagement empowers publishers and advertisers to dig into ad-specific issues to identify broken creatives and optimize player apps to maximize overall yield, engagement, and campaign performance.
 PHT analysis is just one way that publishers and advertisers can understand the value of their content and ads. Learn more about Conviva’s real-time measurement of QoE and engagement across content and ads on every stream, every screen, every second.


