In an era where streaming quality separates industry leaders from the rest, providing a top-tier viewer experience is more than just a goal—it’s an absolute necessity. Today, making decisions based on guesswork isn’t just inefficient—it’s potentially detrimental to your brand.
Enter the world of Conviva’s Streaming Performance Index (SPI) – your one-stop solution for transforming your streaming service. As a recognized leader in streaming analytics, Conviva has developed the SPI, a powerful tool that not only measures streaming quality and viewer experience but also guides your strategic decision-making process.
The stakes are high, and the time to act is now. In the fiercely competitive landscape of Video on Demand (VoD) and live-broadcast services, SPI is more than just a game-changer—it’s your key to dominating the market.

SPI is a powerful measurement tool that encapsulates multiple factors affecting the quality of streaming and the viewer experience. Through an ultra-lightweight client-side SDK, Conviva integrates seamlessly into your existing streaming workflow. The tool dynamically assesses various parameters in real-time, using minimal system resources while delivering maximum analytical power. This approach eliminates guesswork and provides actionable insights that you can use to enhance your service. The SPI not only measures the quality of experience (QoE) but is designed to guide you in improving it, effectively bridging the gap between data and decision-making.
With Conviva’s ultra-lightweight SDK, transform data into action! Seamlessly integrate our tool into your workflow and take control of your streaming performance in real time.
In the increasingly competitive landscape of Video on Demand (VoD) and live-broadcast services, SPI has become a necessity, shaping the future of streaming experiences. That’s why industry leaders such as Paramount+, Sling, NBCU, and more have integrated SPI into their streaming workflows. Whether you’re a well-established brand or a newcomer in the industry, it’s time to navigate your journey in the streaming realm with the precision and insight that SPI offers—just like these major players do.
Key Insights

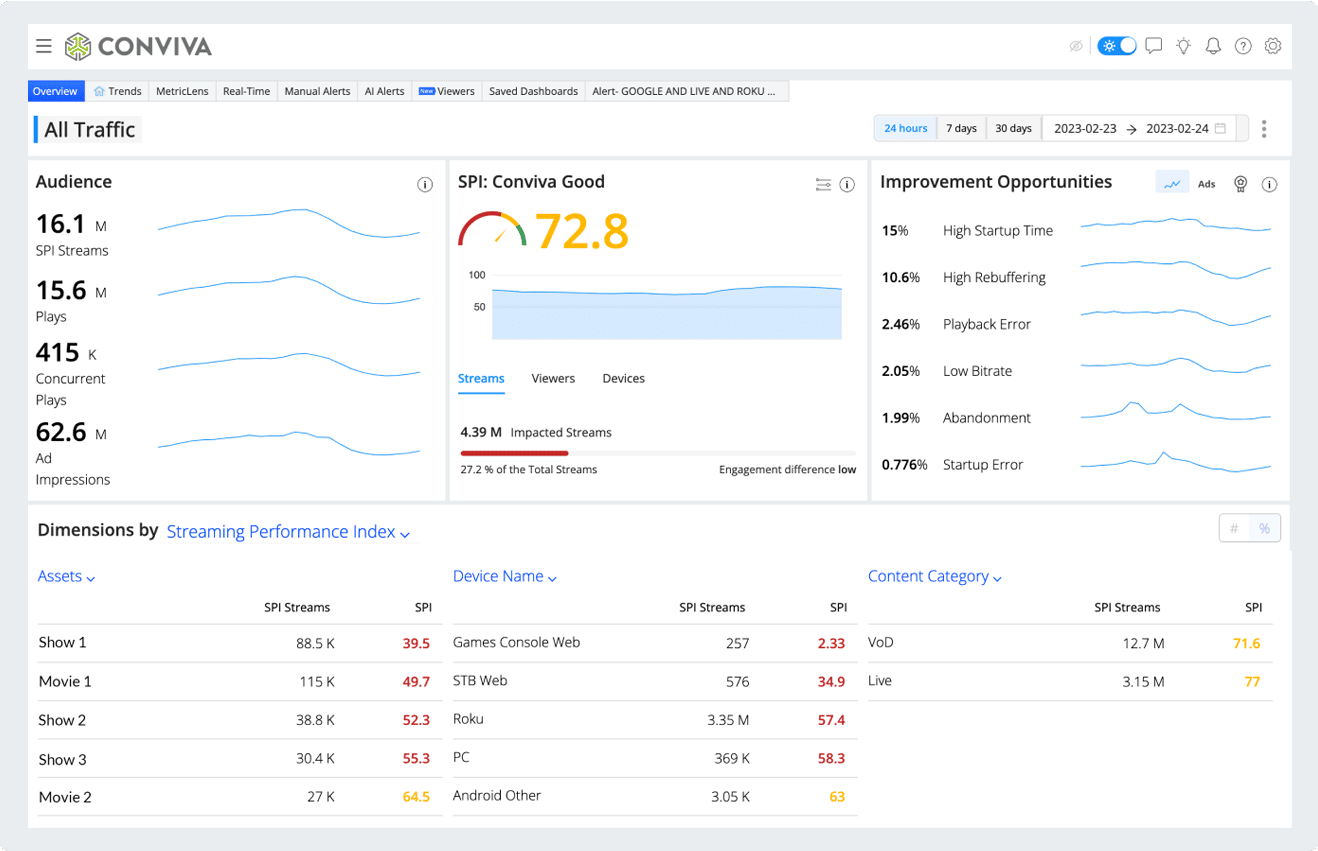
How does SPI change the game in the world of streaming? It transforms the way QoE for video streaming is measured and actioned. Traditional methods can be confusing with a sea of variables and session data. But SPI simplifies it all by combining a near infinite number of variables across all sessions into a single metric. With SPI, you can clearly visualize KPIs, track the performance of critical metrics over time, and easily determine the number and percentage of streams that are not meeting one or more of your adjustable KPI settings.
Make Decisions Based on Quality Data
Quality data is the foundation of effective decision-making. Take, for example, when you’re measuring viewer experience. It’s important to know how many viewers left a session before the video even started due to a slow-loading player. But you also need to discount those incidents where the wait time was not significant enough to impact the viewer experience.
This is where Conviva’s SPI comes into play. It represents a comprehensive view of all streams monitored by Conviva that impact your service’s overall QoE. Certain occurrences, like Early Video Start Failures (EBVS) without significant wait time or geo-blocking errors, are usually the result of viewer behavior or specific business strategies. Some analytical models might include these events and skew your data, but Conviva’s SPI omits them for a more accurate representation of QoE.(need to explain the business impact of this skewed data vs accurate reporting).
The same principle applies to monitoring buffering. It’s crucial to measure buffering incidents, but only those caused by delivery issues should be taken into account. Instances of buffering that occur due to user navigation within the video player’s functions are considered acceptable and should not negatively impact your data.
It’s clear from these examples that there isn’t a single performance metric that can fully encapsulate QoE. EVBS and buffering caused by connection issues are significant factors, but they’re only pieces of a much larger picture.
The real key to enhancing QoE lies in understanding and interpreting all these metrics collectively, not individually. And that’s the power of Conviva’s SPI.
Gain Total Visibility with a Holistic Formula
QoE comes from a mix of technical factors, which makes pursuing any one factor ineffective at best — but there’s another reason you need a standardized, holistic metric such as Conviva’s SPI. Even if you do manage to identify the most important factors in QoE, the extent to which each determines quality is likely to vary based on the type of stream, the end-user device and OS version.
-
- For example, maintaining a specific bitrate might be very important for a large-screen television. It might be less important for a smaller-screen device with lower resolution. Conviva automatically takes factors such as this into account when calculating SPI. Specifically, the current formula for SPI comes from the percentage of streams with:
- No errors (Video Start Failures-Temperature (VSF-T) or Video Playback Failures-Temperature (VPF-T))
- No or very low rebuffering (using Client Initiated Rebuffering Ratio (CIRR))
- Acceptable picture quality based on average bitrate for different screen sizes
- Acceptable video start time
- No Early Video Start Failures (EBVS) if the viewer was waiting a long time before exitingUnlike mission-level metrics that identify specific issues, the Conviva SPI is a strategic, holy-grail metric for streaming providers. It also lets you adjust settings for each metric in the formula based on two categories of performance: Good and Best.
The best part: It’s actionable. Anyone can drill down from SPI with just a few clicks to get to the root causes of QoE loss — down to the exact device, OS version, service, or property.
Utilizing Continuous, Fast, and Census-Based Data
Shifting gears to a broader perspective, you may wonder why analytics are such a key aspect of your operations? The answer, which holds true for most publishers, is simple: informed decision-making relies on relevant, comprehensive data that allows stakeholders to address issues in real-time.
At Conviva, our platform offers a robust suite of streaming analytics tools. These tools empower you to gain an instant understanding of the viewer experience and generate real-time key metrics. The guessing game ends here. With Conviva, you’ll gain access to detailed, real-time data that traditional QoE-measurement solutions miss.
Measure Every Aspect of the Audience Experience
Conviva’s SPI represents an end-to-end view of your stream in two respects. First, the underlying logic depends on a stateful data model that represents a continuous stream of events rather than many discrete events. Second, Conviva measures every aspect of the audience experience, from video start to ad performance, to give a complete, quantifiable narrative of every viewer’s real-world experience.
Traditional analytics models depended on data warehouse structures. The problem is that these architectures are table-based. They essentially need workarounds to provide the stateful data necessary for video analytics.
Conviva’s system has timelines at its core. This newer architecture allows one to focus on each metric in the overall context of the viewer experience. That means you do not just detect buffering in a video, but you can understand the context around that buffering event and how it changes over time as the issue continues or is resolved. It puts the insights you need within reach, no matter how far you scale up your operations.
Sub-60-Second Reporting Latency at Scale
SPI is an ideal KPI to inform long-term strategy, but you can also use it and its underlying analytics to empower fast, targeted fixes. This is, again, because the core architecture is specifically designed for analyzing big data streams.
This capability combines with Conviva’s interface and services to provide near-instant alerts and insights. It works across every session at any scale. That means your teams and automated processes will have the actionable data they need — right when they need it the most.
Bringing Disparate Efforts Together
Large organizations are complex, and SPI is ideal for bringing complex efforts together under a single, unified KPI. Because it provides a holistic view of QoE based on end-to-end, census-based measurements of critical KPIs, it unites advertising, break-fix, optimization, and business strategy teams.
This unification works because your organization has one vision. That vision has something to do with providing a high-quality service.
SPI is a key streaming performance indicator. It shows you how well your company is doing in pursuit of its vision. Better yet, SPI is holistic — everyone’s efforts contribute towards it.
Many Conviva clients have operationalized SPI as a single source of truth across disparate teams in globally distributed organizational structures. The true power of it lies in its simplicity..
Teams can see the big picture, but they can also drill down easily when they have ownership over a certain contributing metric. They can do more than just find the root cause of an issue: They can see and track how their resolutions directly impact SPI.
SPI can also be an effective measure of viewer engagement. Viewers with a higher SPI typically spend more time watching content – that means more ad revenue, higher subscriber engagement, and a decrease in potential churn. Teams outside of technical operations can leverage SPI as a critical benchmark to improve business outcomes far beyond QoE.
Market sizes are growing in many streaming sectors, and brands need to differentiate themselves from the competition.
SPI closes the decision-making loop for all engineering efforts, from optimization to emergency issue resolution. By coming back to the SPI, team members can objectively assess the decisions they have made in the past and improve the ones they make in the future. In an increasingly competitive environment, this kind of accountability provides the edge that organizations need.
Unleashing the Potential of SPI
Beyond SPI, Conviva partners with publishers to get them the data they need to dominate their markets. Real-time actionable insights, AI-powered alerts, and a flexible user interface are just the tip of the iceberg.
Ready to unlock the potential of the SPI? Partner with Conviva today to gain the data-driven insights you need to dominate your market. Click here to request a demo now.


