


Reduce MTTX.
Discover the ultimate flexibility in analytics with our revolutionary interactive interface. This is not your limited, traditional dashboard.


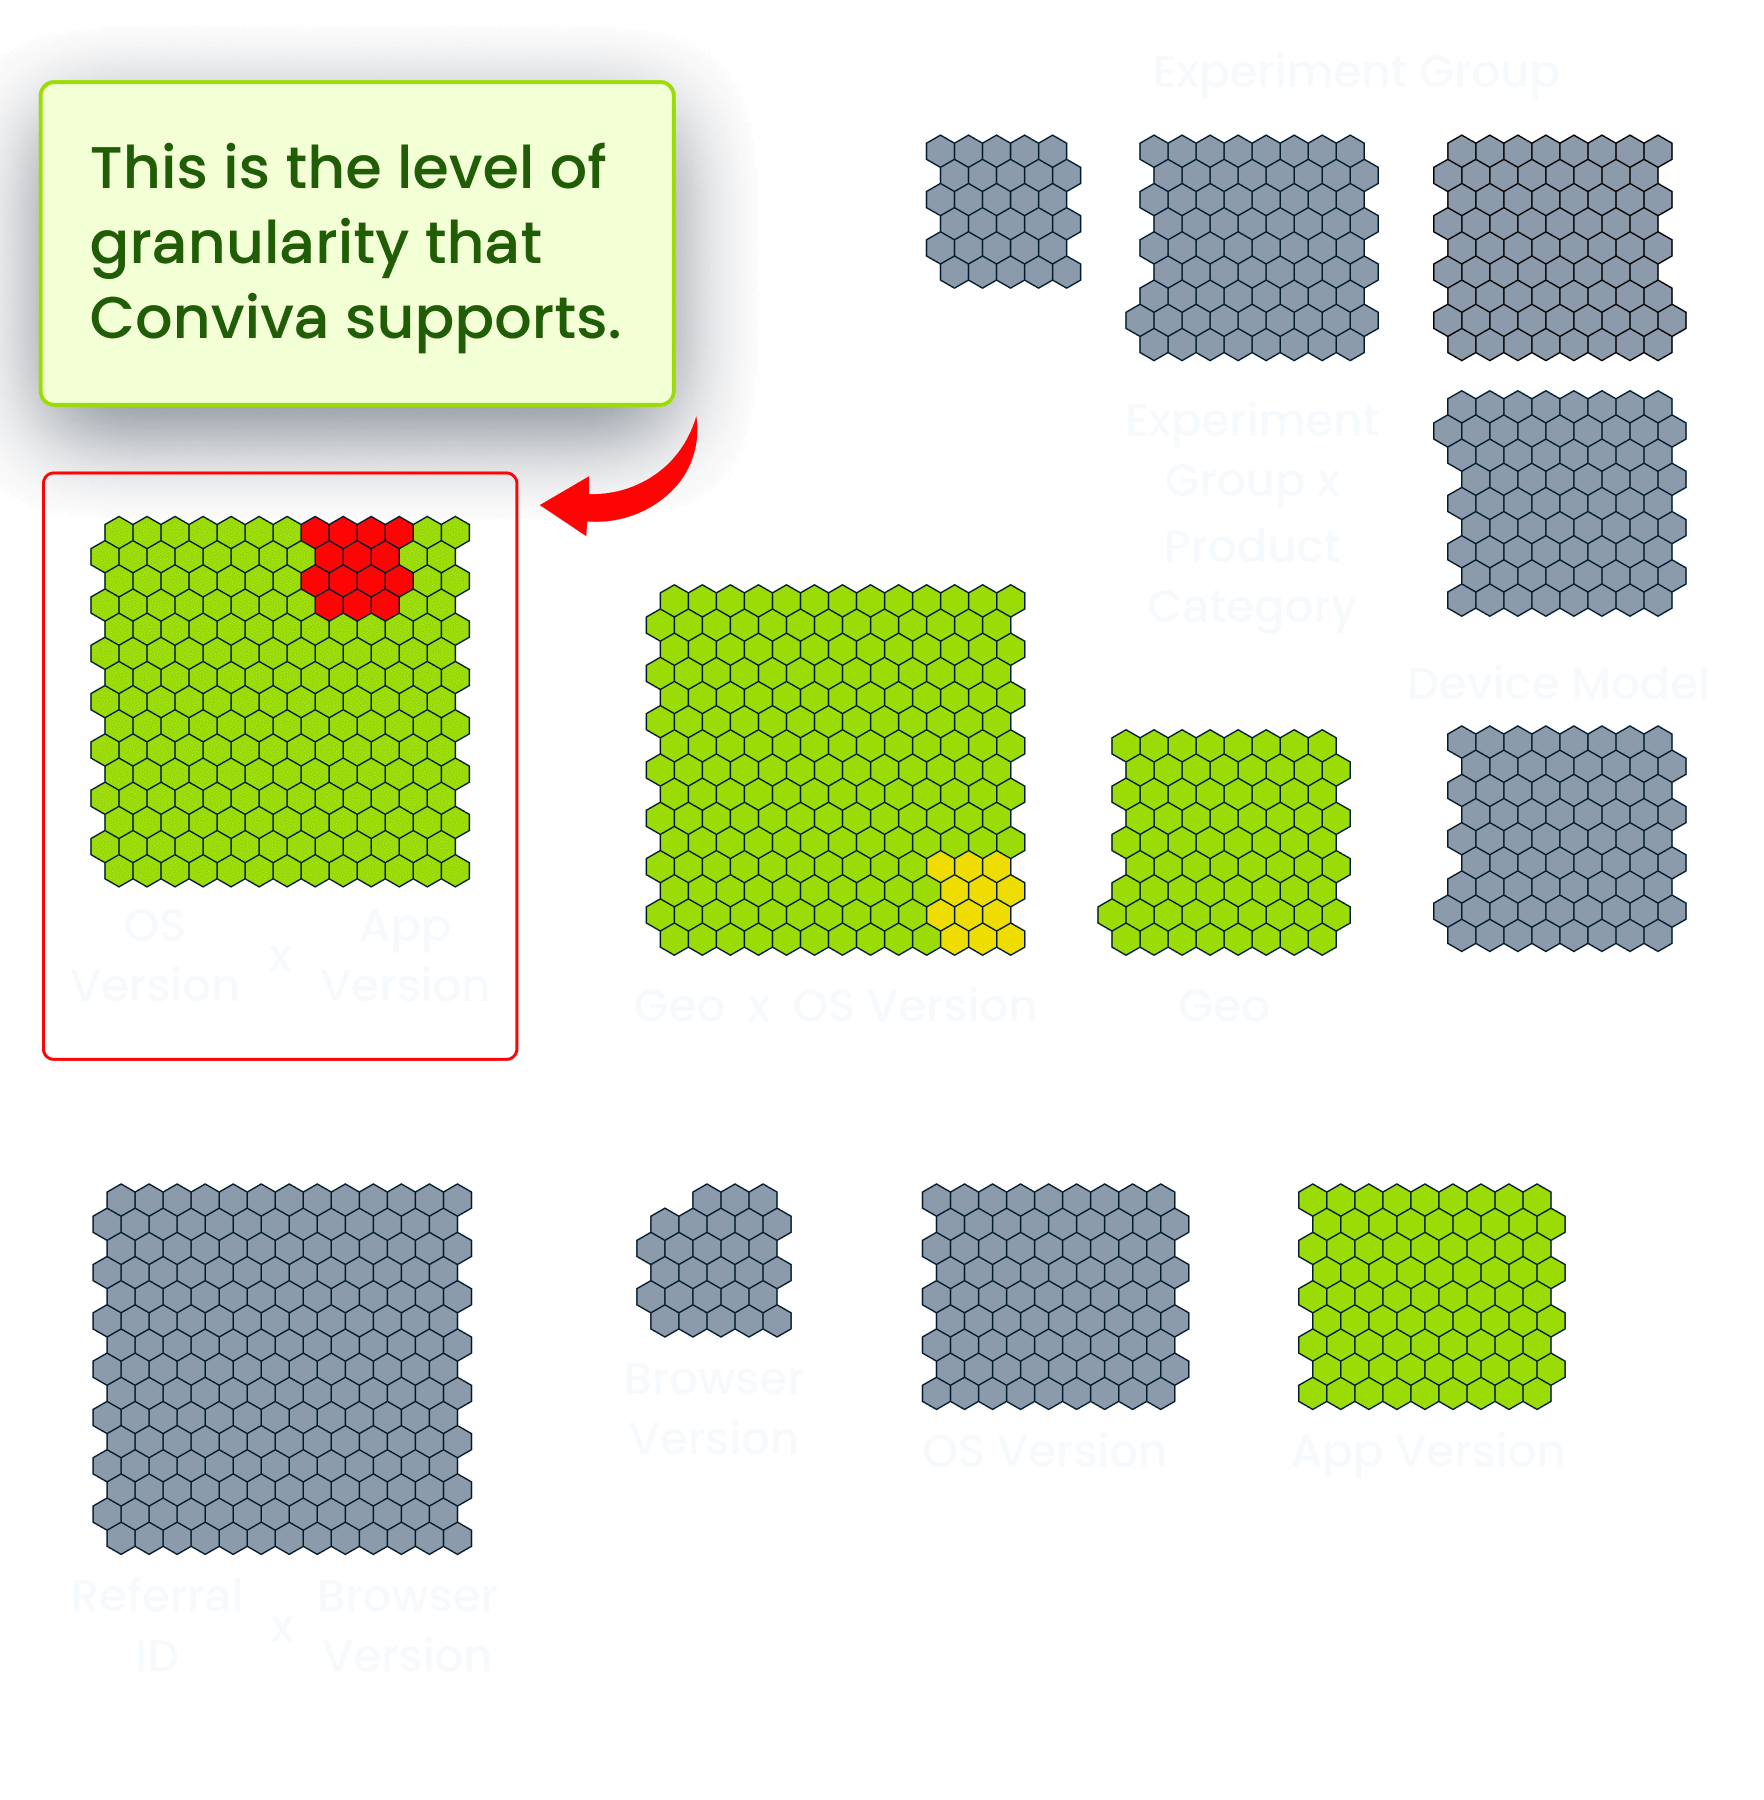
Dive into any combination of metrics and dimensions effortlessly.
With an infinite level of drill-downs, Conviva allows you to zoom in from QoE metrics right down to root cause, individual users and sessions, and impacted trace IDs, seamlessly bridging the gap between real-time insights and historical data analysis.
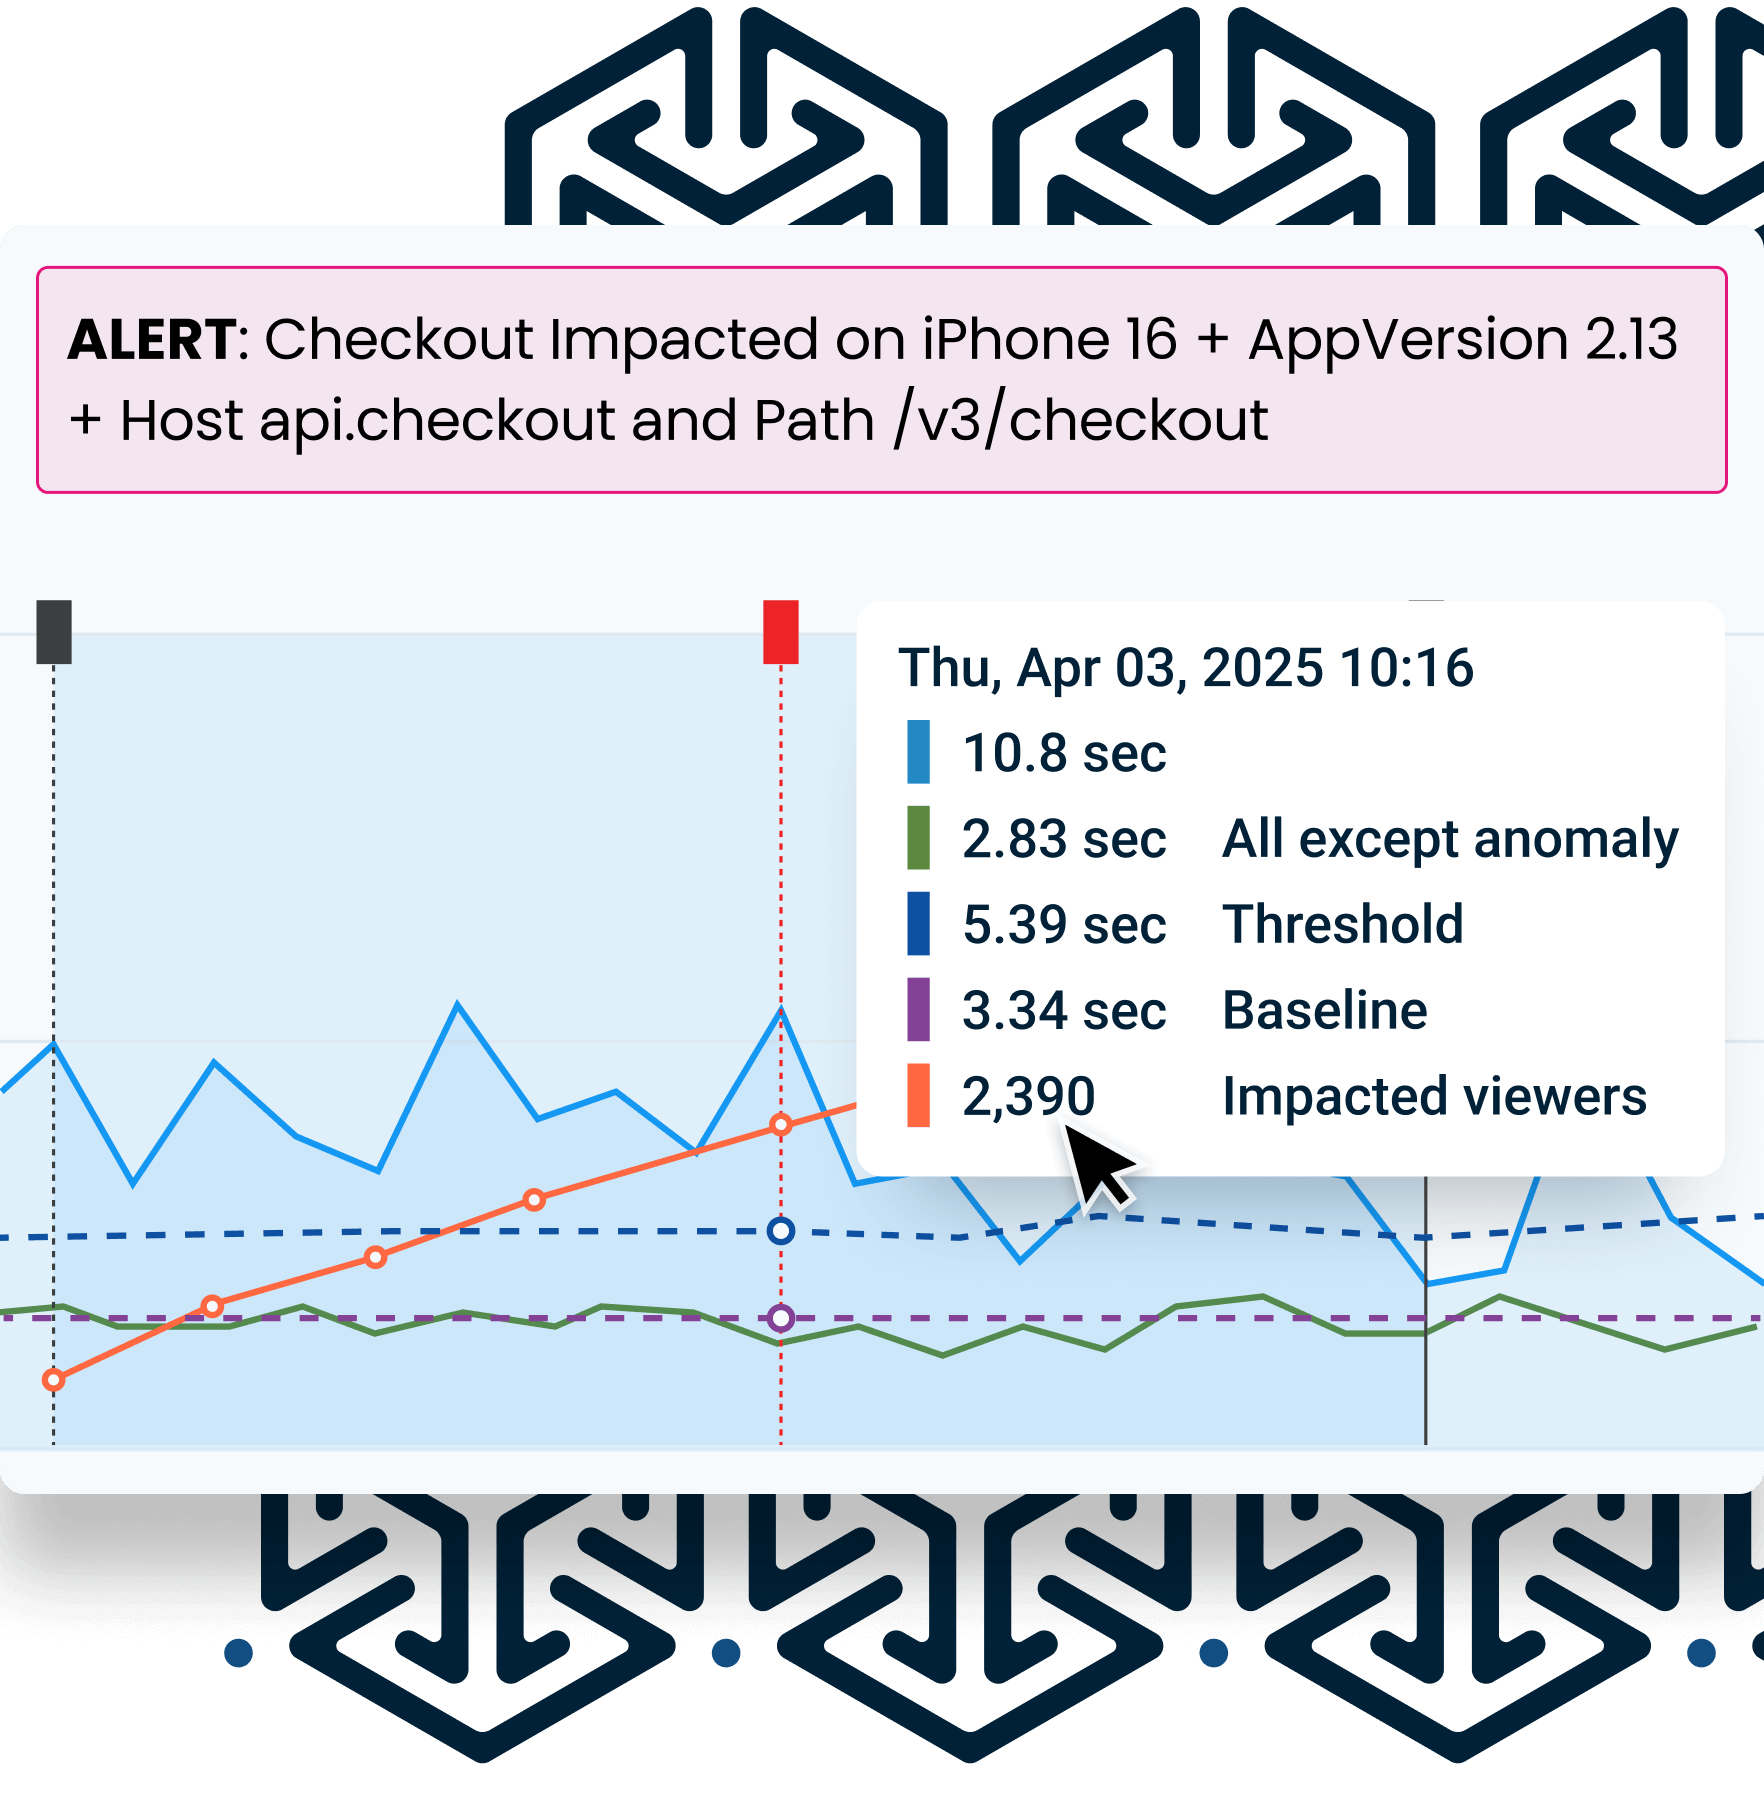
AI alerting
Get real-time anomaly detection and automatic diagnostics usings 100s of metrics across 10s of thousands of dimension combinations (yes, you’re reading that right) so that Operations and Support Teams can ensure flawless experiences.
Multi-dimensional drill down
Experience the future of real-time monitoring with our AI-powered interactive interface, designed to keep you ahead of the game. Our intuitive UI not only tracks real-time trends but also prioritizes issues as they arise, bringing critical concerns to the forefront automatically. With AI-set thresholds, you’ll know instantly when something needs your attention, all powered by the same advanced technology that drives our AI Alerts.
Welcome to the next level of operational excellence.
For your biggest days from Black Friday to World Cup, our interactive interface has proven its worth during some of the biggest events in the world. It was the backbone of monitoring for the 2024 NFL Playoffs, handling over 16.4 million concurrent plays with ease. And that’s just the tip of the iceberg—across all events, Conviva managed more than 30 million concurrent plays.
The scale of data we process and the speed at which we compute stateful metrics in real time is truly remarkable. Ready to take control with a monitoring solution that’s as dynamic as your needs? Welcome to the next level of operational excellence with Conviva.
