Millions of unique viewers are tuned in to their favorite streaming service at any given moment. So how do streaming companies monitor performance, identify and troubleshoot the cause of service disruptions impacting any and all of them while they’re still in session?
That level of granularity can feel like looking for a needle in a haystack. And in a highly competitive streaming market, your ability to find the root – cause across infinite combinations impacting a specific set of viewers quickly is critical. Time is everything. Without efficient responsiveness, you could lose viewers because of just one bad experience.
So how do the world’s leading streaming providers troubleshoot service errors in real-time? It requires both comprehensive data and flexible analysis. You need a comprehensive view of your entire viewer base at any given moment, configured to surface the metrics that matter most to you. You also need the flexibility to slice and dice those key performance metrics, drilling all the way down to a specific viewer experiencing a unique issue.
Introducing: NEW Trends dashboard

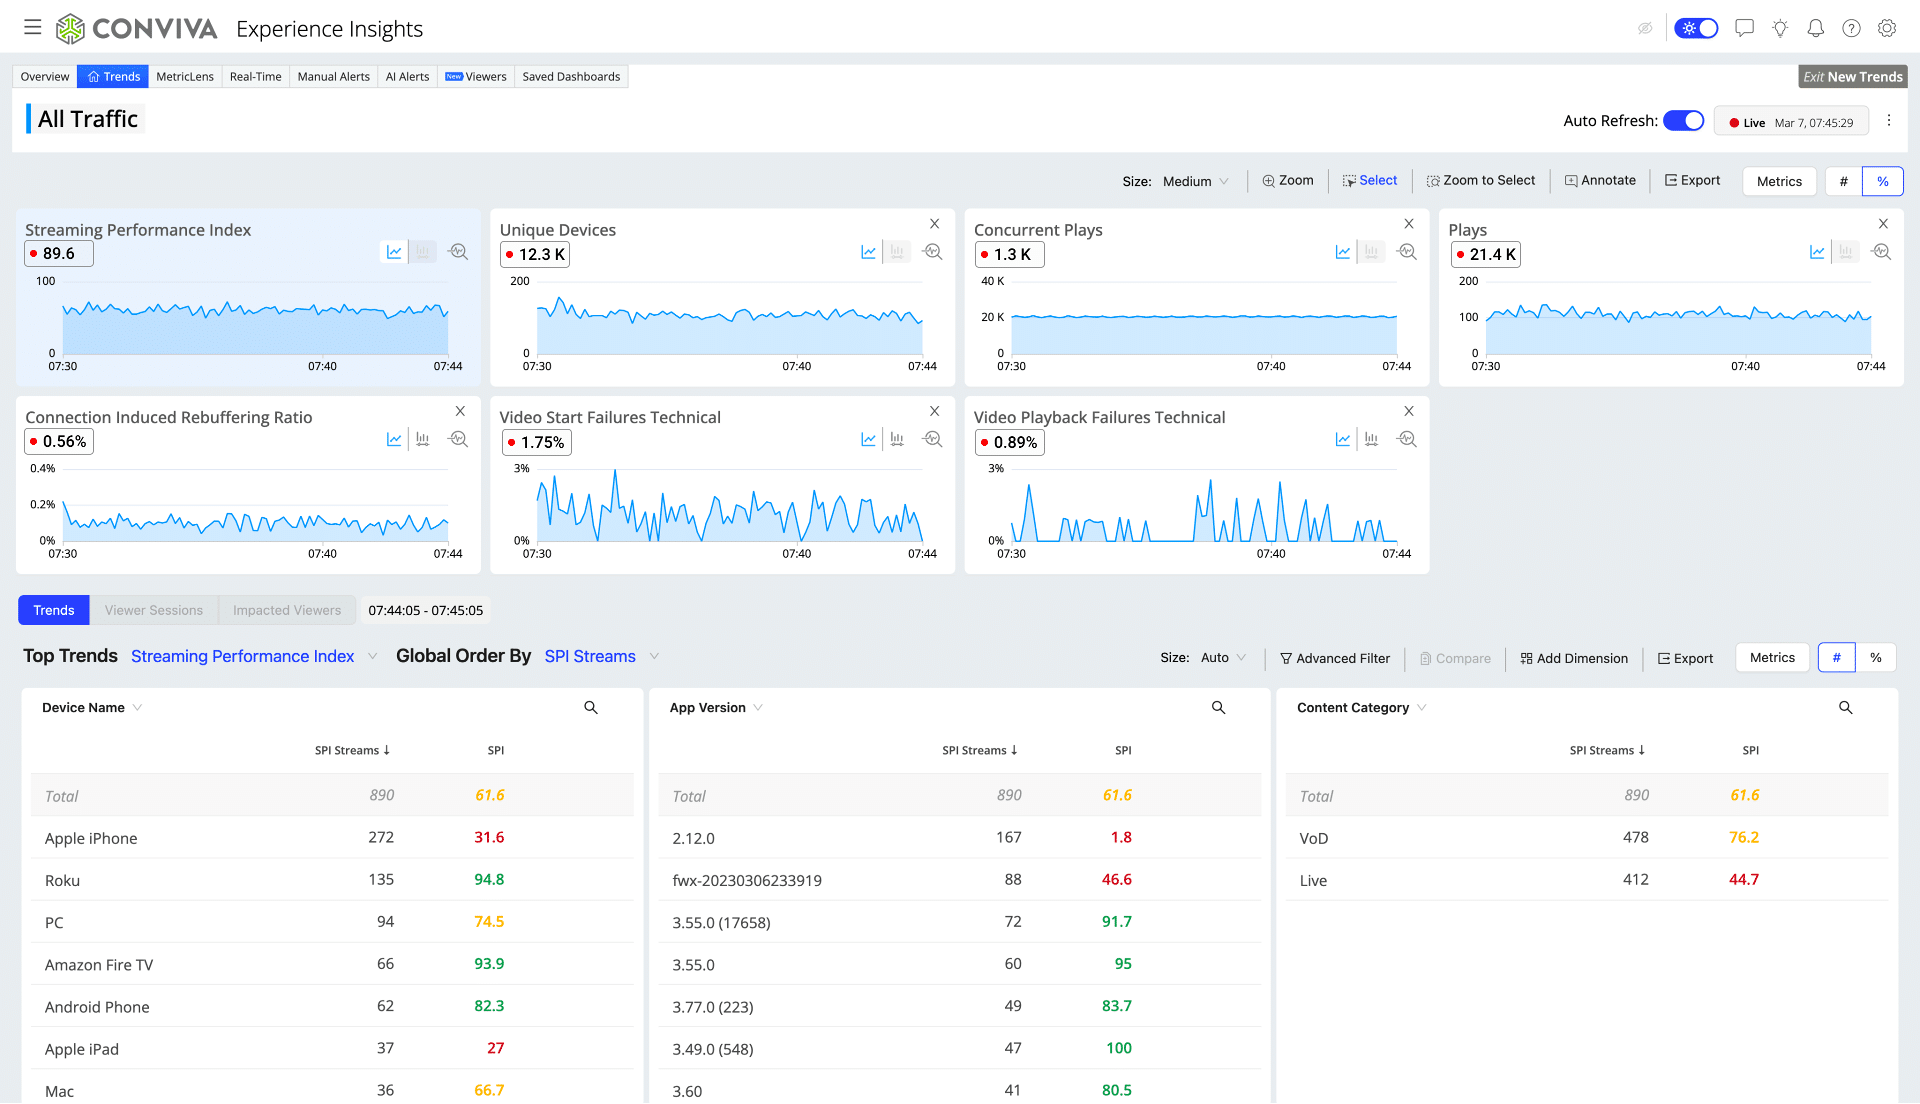
Our team has completely reimagined our Trends dashboard to arm every customer with the power of multi-dimensional, real-time troubleshooting. Now you can get to the root cause of any issue faster and start solving it while viewers are still in session. Conviva’s Trends dashboard now features:
Real-Time: All data is now delivered in real-time, so you can monitor and address what a viewer is experiencing right now. As speed becomes a critical differentiator against the competition, real-time responsiveness can make a massive difference. With other solutions, teams have to wait hours for data to load before they can even identify if an error has occurred.
Customizable, Responsive Layout: Only see the data you care about. You can now customize your dashboard to surface only your key metrics and toggle between visualizations to see the data however you want. You can now also toggle between timeseries and distribution views and between percentages and absolute values. Reorder metrics, dimensions, and more any way you need to see them.
Metrics Toolbar: Uncover root-causes in a few clicks with enhanced slice and zoom functionality. Notice a spike in video start failure? Click directly on that metric card to slice through millions of viewer sessions and instantly filter to those sessions with high VSF.
Advanced Instant Filter – Find the data you’re looking for instantly. We now offer enhanced filtering capabilities to support complex filter conditions, like unknown values and multiple metric filtering, to surface niche issues impacting viewers.
With these enhanced capabilities your team can solve viewer issues faster, leaving you with more time to focus on the critical activities that impact profitability and revenue growth.
Take a look at our feature spotlight to see how metric filtering can help teams uncover the root cause of high video start failures.
Advanced Trouble Shooting in Action
Our customers are already unlocking the power of multi-dimensional, real-time troubleshooting with our reimagined Trends dashboard. While you can solve an infinite number of real-world challenges with our new Trends, here are a few ways that our customers are leveraging Conviva to improve their streaming operations and enhance their viewer experience:
Optimizing Adaptive Bitrate
A customer streaming an important live sports event over the weekend wanted to ensure their adaptive bitrate functioned as expected.
In Trends, they sliced viewer data to find sessions with CIRR greater than 1%, more than 5mbps bitrate, and less than 2 minutes of playtime. With just a few clicks, they could surface sessions where a high bitrate caused a viewer to exit after just a few minutes. These were the crucial sessions where ABR was not functioning as it should.
From there, they dove into device types to see if this issue was caused by a device specific error. They identified that Android and IOS devices were overwhelmingly experiencing this issue, with almost 12% of sessions ending in under 2 minutes.
In just a few clicks, the customer identified an issue, which devices were impacted, and what percentage of users with that device were impacted – all while on the same page.
With this insight, the customer could take action to improve ABR while the live event was still in progress, ensuring that no critical ad revenue would be lost due to viewer exits from bad ABR. Post event, they took those learnings to improve their adaptive bitrate algorithms and avoid any similar issues for next year’s game.
Improving Pre-Roll Ad Delivery
Another customer noted a spike in exits before video start. So, they went to the Trends dashboard and filtered to EBVS greater than 35 seconds to find those sessions with a high load time before the video played.
Drilling down into devices, they saw the issue primarily occurred for Android Web users. They then clicked into Viewer Sessions to look at the specific timeline of one unique viewer experiencing this issue. They identified that that specific viewer started pre-roll ads, but there was no reported end to those ads. That meant the viewer’s content never started, and they exited after 35 seconds.
From this detected spike, in just a few clicks the customer was able to identify a previously undetected issue with pre-roll ads. Within minutes, they found the root-cause of a spike in EBVS and had a clear path to fixing the cause of their pre-roll ad error.
The team leveraged data from a single viewer to detect something that could have caused tens or hundreds of thousands of failed plays. Even a fraction of those left unresolved could have resulted in permanent viewer churn and/or millions in lost of ad revenue.
With growing competition in the streaming space, streaming companies must increase their agility in addressing viewer issues while the viewer is still tuned in. The ability to troubleshoot and address service disruptions in real-time can make the difference between keeping a viewer engaged or losing them – and all of the revenue potential they represent – to a competitor.


