How does one find issues that affect a smaller set of users but it is still significant enough to impact overall viewer engagement? In most cases, these smaller issues can have significant impact on viewer retention and potential subscriber churn.
New Trends has been built with the purpose to increase the speed of error resolution. Any Pulse user can now use the tools and features at their disposal to drill down to a root cause in a structured and informed manner.
Let’s walk through an example in our new Trends dashboard.
In the image below, you can see that for a given day, the Streaming Performance Index (SPI) score is 90.9. It is a fairly high score and the time series line in the metric card is steady and smooth. So how does one find an outlier here?
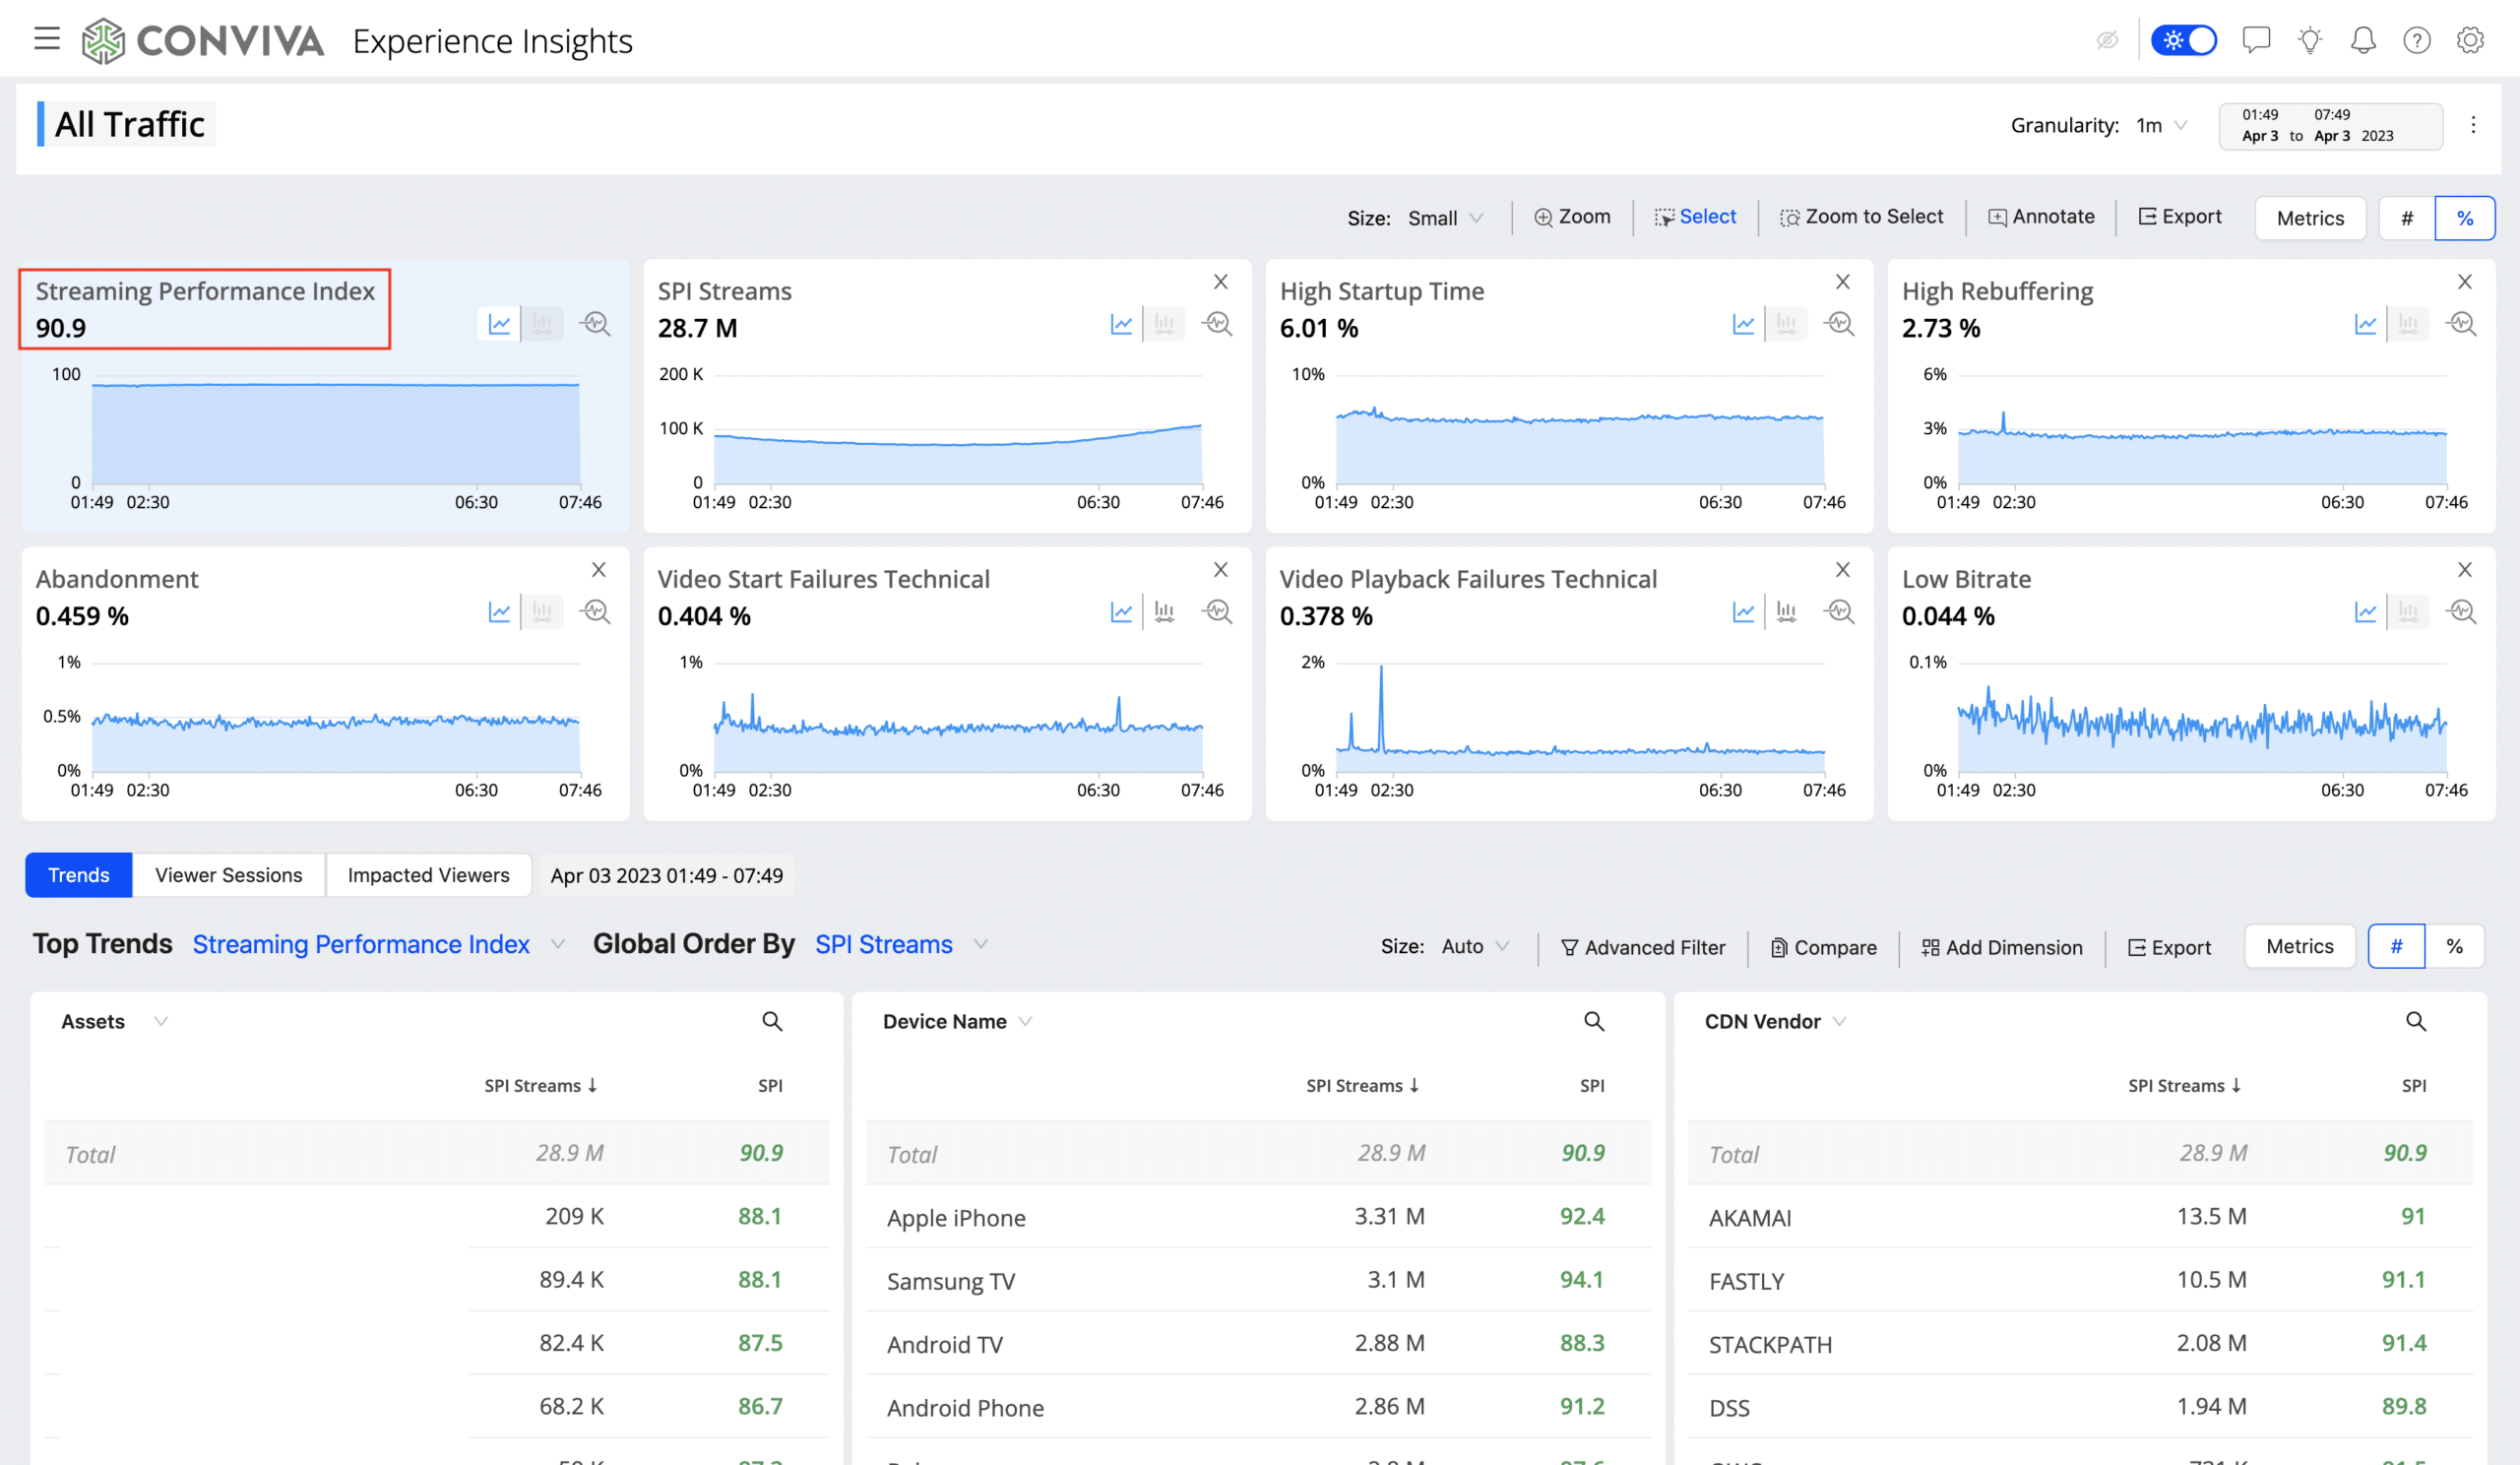
What you see above is the aggregated SPI score for this time range and ‘All Filters’. To find an outlier, you can select the dimension you are interested in and scroll to a value that has a lower SPI than the aggregated SPI score of 90.9. I chose Device Name to troubleshoot further and identify ‘LG TV’ has a much lower SPI score than others.
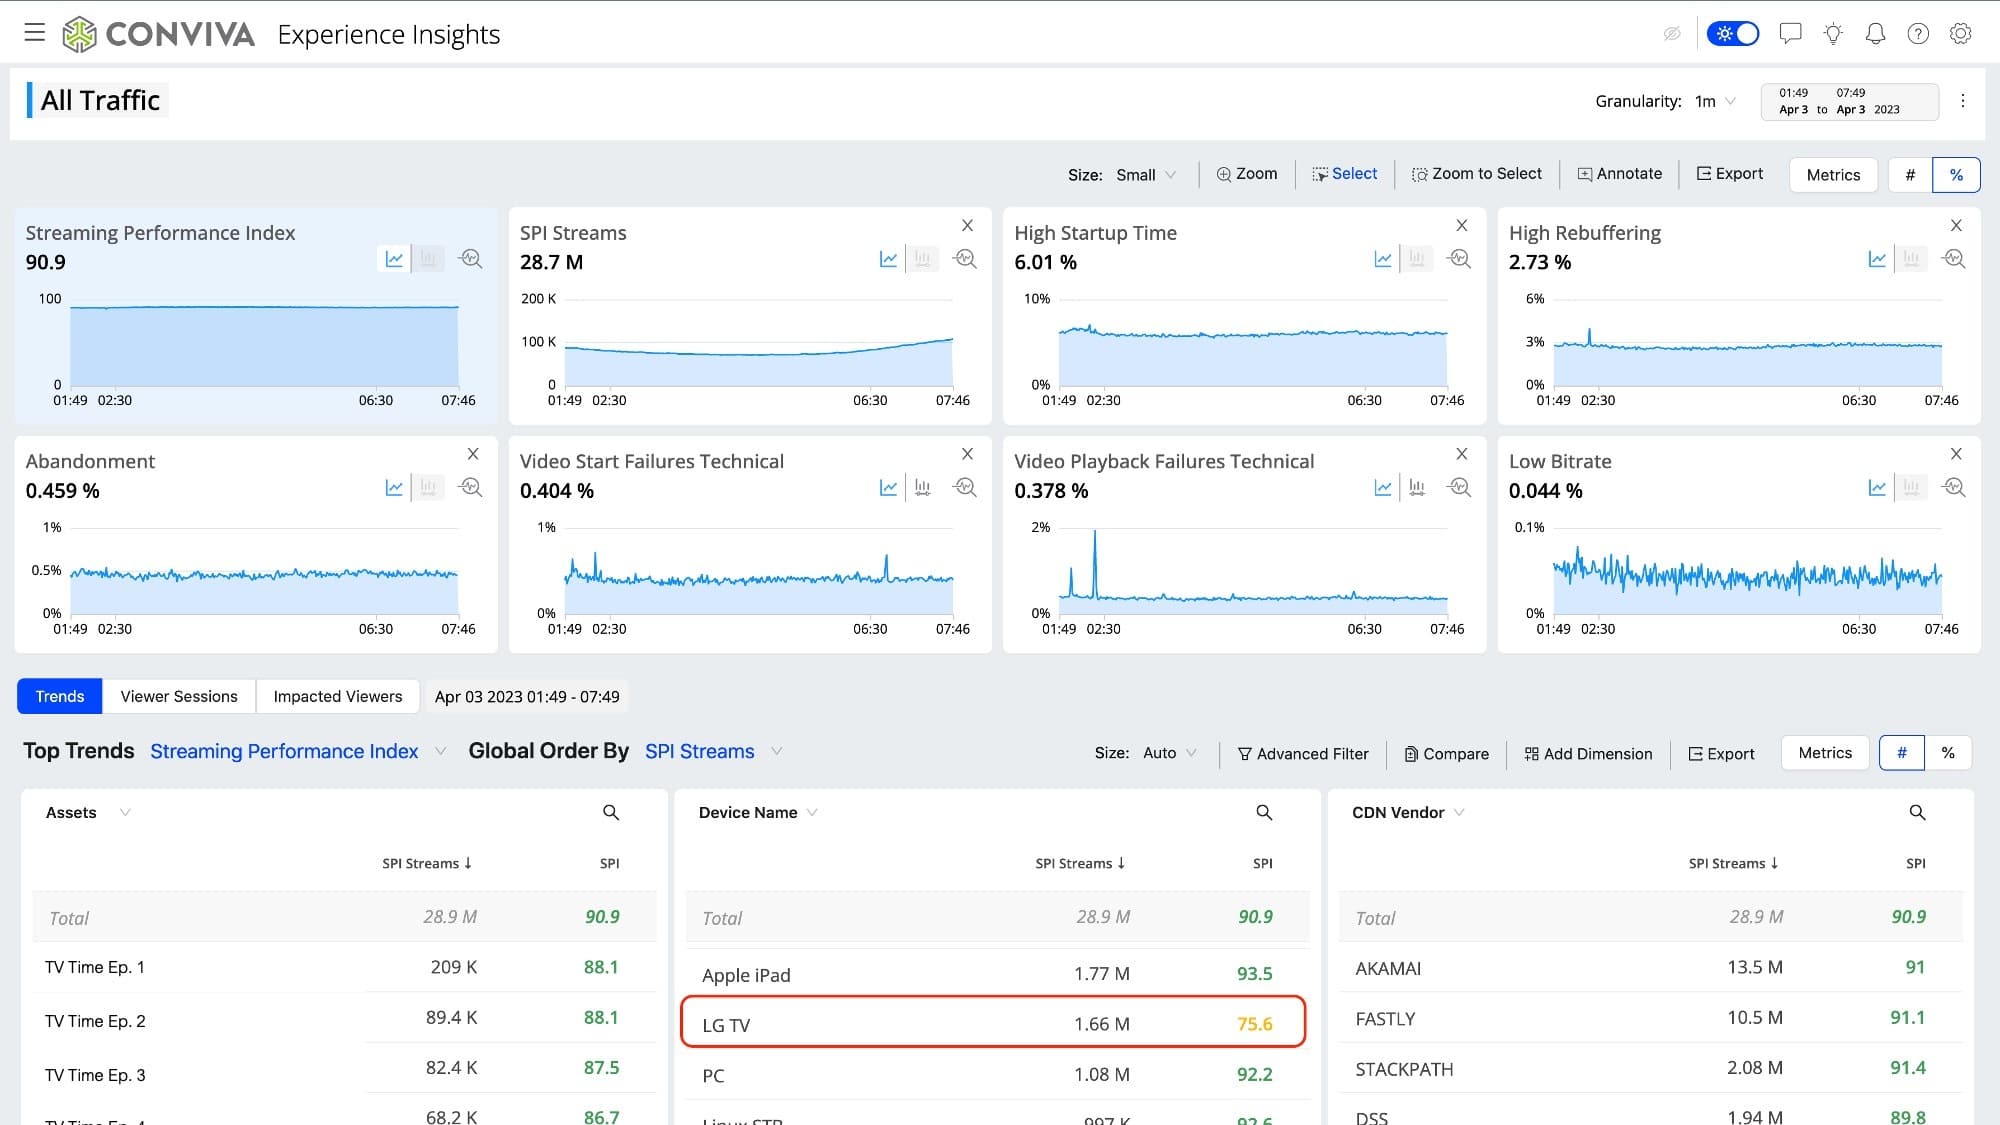
I filter on ‘LG TV’ since its SPI score is 75.6 and noticed that it is 5.78% of all the SPI Streams. Furthermore, 19.6% of these SPI streams had ‘High Startup Time’.
[High Startup Time shows the percent of Plays (at least 1 frame of video displayed) that took too long for the video to start.
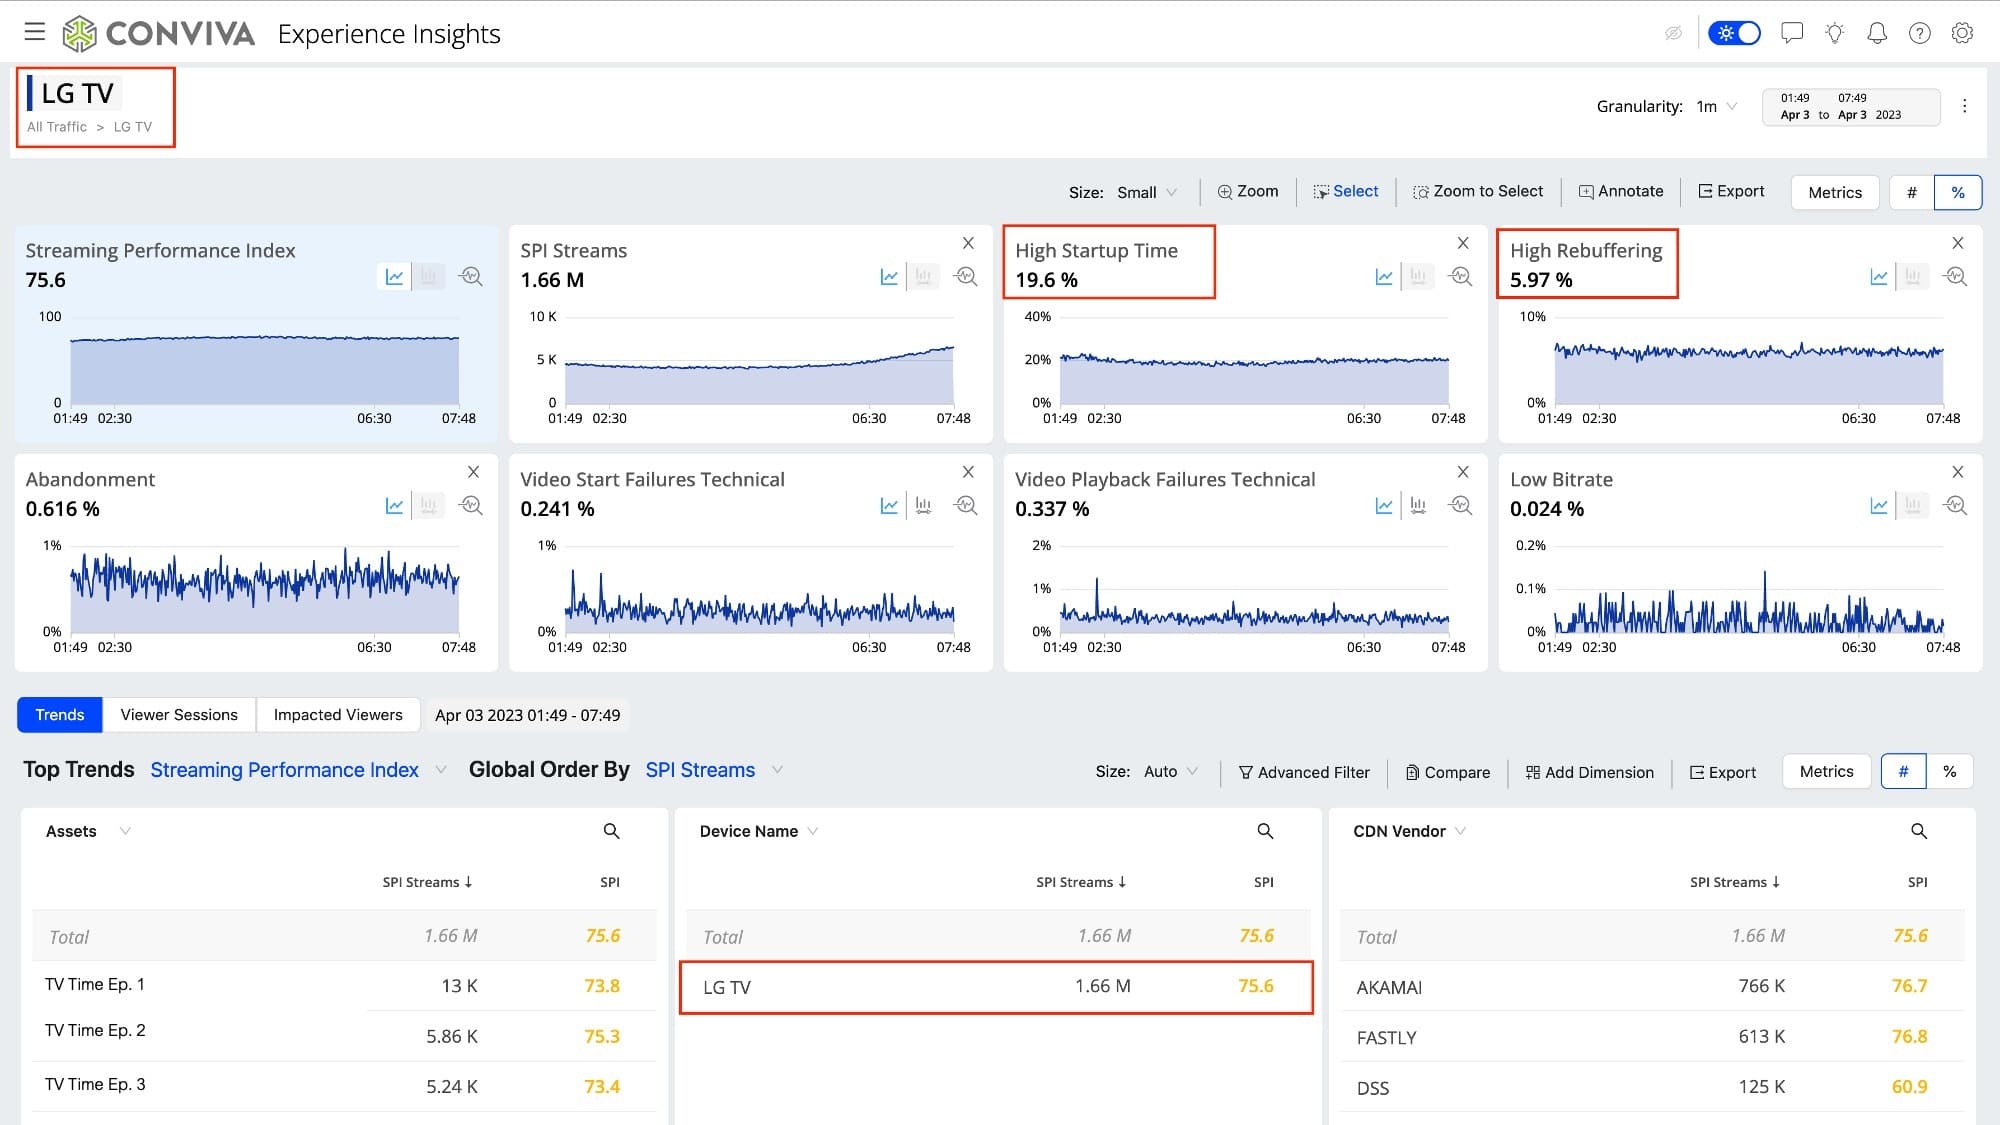
The High Rebuffering metric has more than doubled to 5.97% (LG TV) from 2.73% (All Devices) but I will continue to focus on High Startup Time for this analysis.
As you can see above, LG TV devices have significantly contributed to the High Startup Time metric and are indicative that the bulk of the issue is concentrated at the start of the session.
High startup time can be caused by multiple issues and here a user can branch out the investigation in different ways:
- Continue investigating the device thread and check for OS version or any recent updates to the video codecs, etc
- Drill down further based on network and check for different CDN or customer network performance to isolate the root cause
- Concentrate on Geographical areas and filter further on regions/countries that can lead to the root cause
Quality of Experience (QoE) for the user can be impacted by many factors including High Startup Time as seen above. If the viewing experience is below par the viewer will be at risk of churn and that will impact revenues and the business. With the advanced tools introduced in our new Trends dashboard, Conviva is empowering our customers to find the outliers that are sometimes hidden within the larger data set and take action to improve quality of experience.


