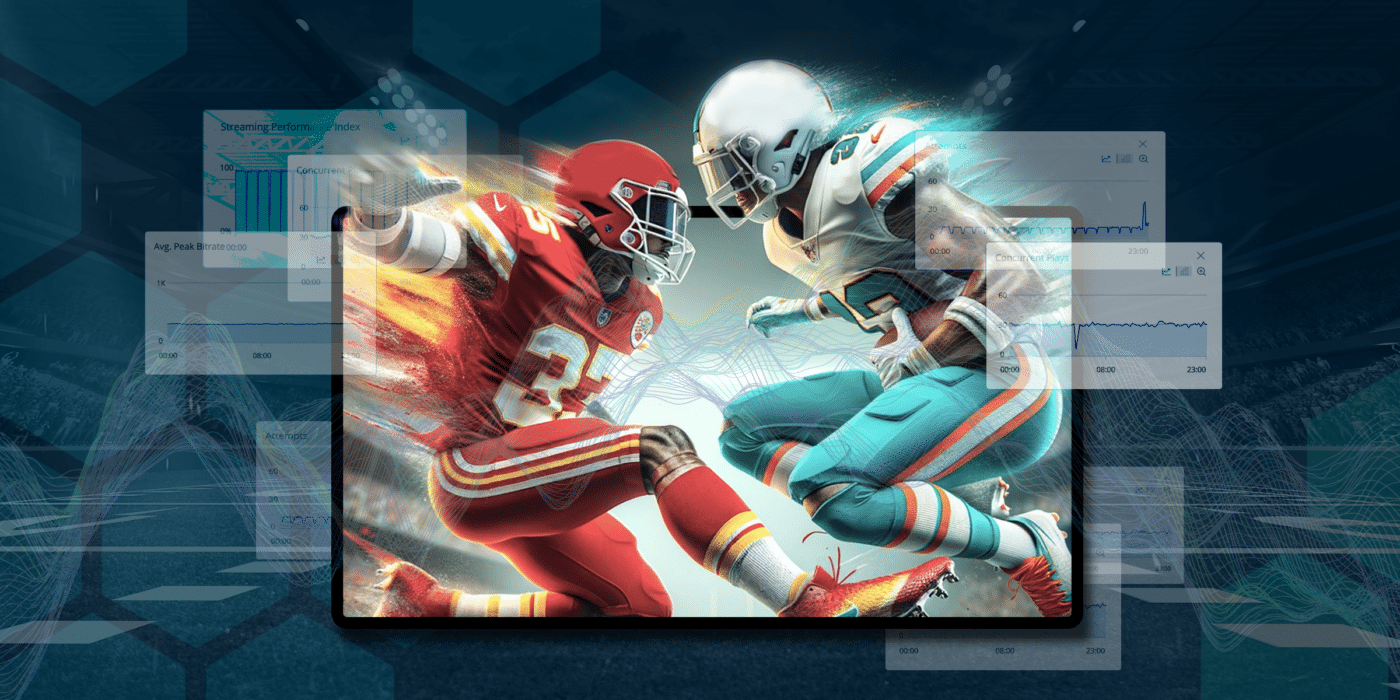
This past Saturday’s playoff game represented the highest day of internet use in US history. NBC Sports reported that Saturday’s Chiefs / Dolphins game reached 27.6 million viewers, ranking as the most streamed event in US history. Aside from customers grumbling about navigating a paywall to watch an NFL playoff game, the event itself seems a tremendous success. Conviva is proud to continue our eight year partnership with NBC Universal.
For product, engineering, and operations teams tasked with delivering the digital experience, there’s a few things to learn. 12 of the 15 largest global media brands use Conviva to own user experience and engagement across their customer journeys, so we know a thing or two about how teams can prepare and deliver massive internet events.
Here’s three takeaways and some color commentary from this weekend’s record-breaking game:
Customer experience is about the full journey
Peacock seemingly delivered a flawless experience on Saturday. It appears the only hiccup was the paywall, which itself worked fine, but possibly irked users used to watch football for free. For product, engineering, and operations teams delivering the experience, success is measured by the entire experience, not one specific page or component. For the customer, Saturday’s event had a few core components: sign up, log in, select experience, and watch event.
COLOR COMMENTARY: The game reached nearly 28 million viewers, with peak viewership at million viewers between 9:15 and 9:30PM. It was the most streamed event in US history, and outperformed previous NFL game streaming records by 6%.
Driving an event this big can often require superhuman visibility of the customer journey. The challenge? Operations , engineering, and product teams using Digital Experience Monitoring, Observability, or Product Analytics often must piece together fragmented UIs, isolated page metrics to receive a real time view of digital experience. Conviva illuminates the entire customer journey, helping teams correlating every event, custom metric, and session to understand how system performance results in user engagement.
Results for big technical initiative must be business-relevant
Launching big technical initiatives are the culmination of massive investments of money, people, resources, and time. Media companies use a combination of cloud infrastructure, microservices, and single page and mobile apps to reach their customers. Rarely is uptime (the site or app being available) the sole success metric. Here’s a look at some stats from Saturday:
COLOR COMMENTARY: The game consumed 30% of internet traffic during the game. Peacock delivered its biggest business day ever to its audience, driving usage, engagement, and viewership across 16.3 million concurrent devices. As a result, the Peacock app ranked number one in the app store and it boosted search by more than 2x on Google. Aside from how many users keep their subscriptions, they’ve generated a massive new audience.
As Peacock drives new content, user feedback loops are critical. The challenge for product, engineering, and operations teams is connecting system performance to user experience and business outcome. Observability solutions require significant developer time to add custom business metrics. Core Web Vitals are becoming more common throughout Observability, but shown in specific page or URL groups, not easily shown across the user journey. Conviva brings business-specific metrics and user engagement to life. We automatically incorporate any existing custom tags and offer one-click customization to quickly add new custom metrics. Teams receive relevant role and business specific measurements to align on user experience, engagement, and system performance.
Problems are inevitable, in case of emergency prioritize big customer-issues
Scaling to reach millions of users is no small feat. The amount of transactions and data sent from Kubernetes clusters and microservices must have been stunning. Here’s some stats from what IT and engineering teams had to monitor:
COLOR COMMENTARY: The Street’s Colin Salao blogged about the game as it happened, and mentioned the streaming went seamlessly overall. “The second half is about to start, and honestly, I haven’t had much of a problem with Peacock, Salao said, “My broadcast has buffered around twice, but only for a few seconds. Nothing that has really bothered me so far.”
For any challenges teams might have faced, the promise of end-to-end Observability may have delayed troubleshooting. Often, engineers using Observability solutions must sift page performance metrics or de-duping traces when customers complain. Alternatively, product teams hoping their launch goes smoothly wait minutes for their data to update. Conviva uses AI and advanced data correlation provides clarity of the biggest customer-impacting issues in real time.
Keith Zubchevich, CEO of Conviva, spoke to NBC in San Francisco about the first ever NFL playoff game available only on streaming.
What’s next always includes the customer
In summary, this Saturday’s event was a game changer for streaming companies and digital businesses. Because of the flawless delivery, we can infer that Peacock’s product, operations, and engineering teams thoroughly tested their systems beforehand, and reacted sufficiently to any challenges during the streaming. The question now is “what’s next?” For Conviva, we’re partnering with digital businesses to ensure massive launches and events drive company success. We’ve expanded our capabilities with AI, alert reduction, and event correlation to help focus on owning experience across every component of the customer journey. As “what’s next” always includes the customer, we’re here to help align teams to own those experiences.
Interested in learning more? Connect with an expert today.


