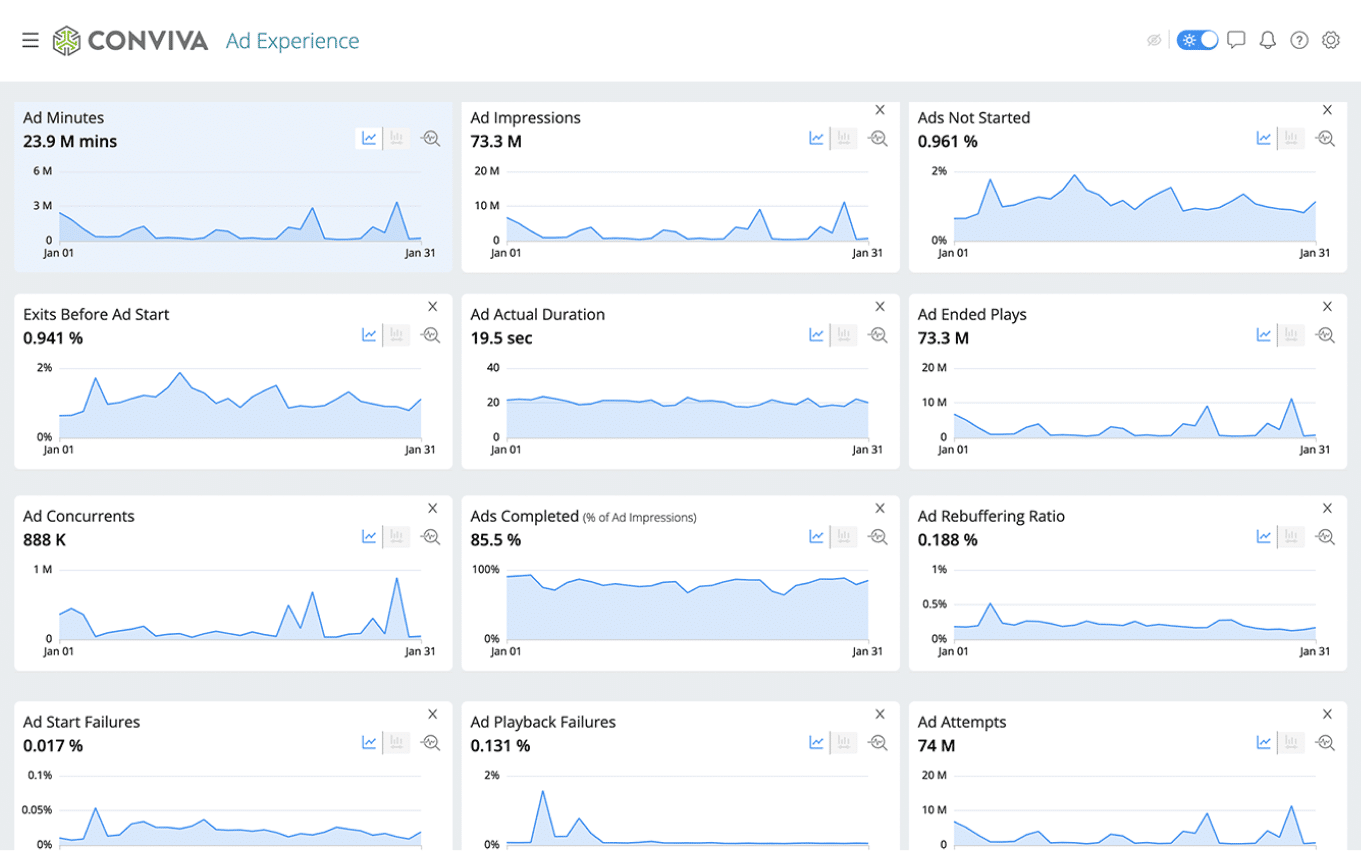
In the competitive landscape of streaming, unlocking the full potential of your ad revenue can seem like a challenging puzzle. But what if you could simplify this complexity? The key lies in leveraging the right data – data that not only quantifies but also enhances your audience’s Quality of Experience (QoE).
In a fast-evolving streaming ecosystem, it’s no longer sufficient to measure just the content experience; the ad experience is equally vital.
Enter Conviva: Our cutting-edge, census-based streaming analytics platform bridges this often-overlooked gap.
Conviva offers an unmatched lens through which you can view and understand your entire advertising strategy and its real-world impact. By illuminating these insights, we not only enhance your ad revenue but also elevate the viewer experience. With Conviva, turn your advertising strategy into your competitive advantage.

Key takeaways:
- Full Viewer Experience: Essential for informed ad policy decisions.
- Streaming Analytics: Enables granular, census-based measurement.
- Roadmap Essentials: Must contain specific metrics and optimization strategies.
- Success Measurement: Achieved by linking ad policy decisions with QoE outcomes.
Step 1: Get the Right Information
Getting the right information is absolutely necessary before you move on with optimizing ad revenue. It’s crucial to understand the performance dynamics of your ads to effectively strategize for higher revenue.
Measure the Entire Experience
You’ll need insight into how ads are affecting the viewer experience. Conviva’s Streaming Analytics Platform is perfect for this type of mission. The old model of ad delivery is changing as OTT and mobile video consumption grow, and you need specific data to navigate this new territory.
Conviva’s streaming analytics platform provides comprehensive data about your audience’s viewing experience, from content engagement to ad interactions. It captures detailed metrics about ad performance and provides insights into different elements of viewer behavior.
Here’s how it works:
- Ad Performance Monitoring: Conviva’s platform tracks key metrics like viewability, completion rate, and engagement of each ad. These metrics give a clear picture of how well your ads are performing.
- Viewer Experience Analysis: Conviva assesses the quality of your viewer’s experience by tracking metrics like buffering rates, error occurrences, and playback failures. By correlating these with ad performance, you gain insight into how the viewer’s experience influences ad effectiveness.
- Ad Quality and Saturation Optimization: Using these data-driven insights, you can adjust your ad strategy to optimize ad quality and saturation levels. If an ad is performing well with minimal viewer drop-off, you can increase its frequency (saturation). Conversely, if an ad is leading to significant viewer drop-off, you can reduce its frequency or improve its quality.
- Ad Placement Decisions: Conviva’s data can show you when and where ads are most effective, enabling you to make strategic ad placement decisions. For instance, you might find that ads placed at the beginning of videos have higher engagement than those in the middle.
Unlock the Power of Time-State Analytics to Boost Ad Revenue
In the quest to maximize ad revenue, understanding your streaming metrics is crucial. With Conviva’s time-state analytics, you gain access to a transformative tool that offers real-time insights, streamlines big data management, and places events within a meaningful context.
Let’s bring this to life with a practical scenario: calculating connection-induced rebuffering time—a critical QoE metric directly affecting viewer satisfaction and engagement, and consequently, your ad performance. This complex task involves discerning the relationship between the player state, user actions (like hitting play or pause), and the Content Delivery Network (CDN) performance.
While traditional analytics models can handle this, they do so at a steep cost of time and resources. As you delve deeper into more nuanced metrics, their inefficiencies become more pronounced. This is where Conviva’s time-state analytics, bolstered by a stateful metrics system, come to the rescue.
Stateful metrics clarify the interconnections between key measurements, offering an unparalleled visibility into your system. This breakthrough approach reduces computational costs and latency, while delivering accurate QoE metrics such as connection-induced rebuffering time.
With Conviva’s time-state analytics, you don’t just save resources and time; you gain sharper insights to drive your decisions. These insights enable your team to swiftly identify and resolve issues that could be affecting ad performance, thereby enhancing viewer experiences and boosting your ad revenue.
Step 2: Build Your QoE Foundation
Next, pivot your focus squarely onto Quality of Experience (QoE). It’s not just about delivering your ads – it’s about ensuring a seamless, high-quality experience throughout. In the world of streaming, QoE is the lifeline of viewer engagement. Without it, your minutes watched and watch ratios—two pivotal metrics for serving more ads—could plummet. So, make QoE non-negotiable, an integral cornerstone of your ad strategy, to keep your viewers hooked and your ads playing
Target Key QoE Metrics
There are various metrics that matter for QoE. Take buffering, for instance: to increase revenue, you have to lower buffering in general and keep audiences engaged with your programming.
The issue is that there are various types of buffering events, each with its own impact. High rebuffering at the start of a video could force a viewer to completely exit before even beginning, posing massive losses in revenue. The same experience during an ad break could result in some revenue loss, but not necessarily impact the viewer’s experience.
Conviva lets you measure specific types of events, such as buffering within the ad wrap versus buffering after a viewer navigates to a different part of a video. This lets your teams target the metrics that matter.
With Conviva, you can also drill down to the way specific aspects of the ad experience affect key ad success metrics. You get hard data on exactly which factors affect engagement along with actionable insight into how to optimize ad performance. This lets you increase revenue by providing more value to advertisers.
Step 3: Find the Perfect Ad Policies
Once you have implemented an excellent ad experience, it’s time to ensure that you’re making the most of your video inventory. You’ll want to measure how increased ad saturation affects key performance metrics. Then push each audience segment to the limit to maximize revenue.
Develop a Roadmap
A critical milestone towards attaining maximum ad revenue is the construction of a strategic roadmap. This should encompass your strategic business objectives, tactical operational goals, key performance indicators, optimization workflows, and accountability practices.
Measure Engagement During Policy Changes
Conviva allows you to get up-to-date metrics on every viewer’s experience as you make ad policy changes. You then can A/B test those policies to monitor how your changes impact view. The granularity and completeness of this census-based data give you more agility as you follow your roadmap.
Maximize Saturation and Engagement
Once you have established processes to monitor the performance of your policy changes, you can continuously work to maximize key ad revenue indicators, such as ad saturation and ad engagement. You might be surprised at how far you can go. For example, some Conviva clients have even had minutes-per-viewer increase as they increase the saturation levels of their optimized ads.
Step 4: Boost Revenue With Data
Data is the key to building ad revenue. Conviva gives you the tools you need to make the right decisions.
Increase Revenue Using Census-Based Data
Conviva has tools that empower your ad operations teams during every step of your revenue optimization strategy. You can discover:
- Where to place ads
- What your ideal ad lengths are
- How to optimize ad delivery
- When you’ve reached optimal ad saturation
- Which service tiers, regions, or even devices have the highest engagement rates and saturation tolerance

Diverse audience segments may respond uniquely to different ad policies. Navigate this complex landscape with ease using Conviva’s potent insights.
Close the Loop on Policy Optimization
Constant monitoring with Conviva also lets you see the differences your decisions make in real-time. You can look at the before-and-after to see if your strategy really measures up to your expectations.
You and your teams might make hundreds of decisions during the course of a single revenue-optimization effort. Learn from your mistakes and build on your successes by using Conviva to keep track of the entire decision-making cycle. Achieving this is feasible with the continuous, granular measurement of every session across your entire service.
Bonus Step: Keep Measuring, Refining, and Fine-Tuning
You can keep boosting your revenue after the initial push is over. Conviva helps you continually monitor and optimize ad experience to make the most of your inventory. Check out why ad experience matters or learn more with live events and demos.


