On February 2nd, Conviva’s streaming analytics platform suddenly ground to a crawl but only for one customer. P99 latency spiked without clear reason, pushing our DAG engine to its limits. What started as a puzzling slowdown soon became a deep dive into concurrency pitfalls.
Conviva’s platform is built to handle 5 trillion daily events, powered by a DAG (directed acyclic graph) based analytics engine. Each customer’s logic is compiled into a DAG, running concurrently on a custom actor model built atop Tokio.
This post unpacks how a seemingly innocuous atomic counter in a shared type registry became the bottleneck and what we learned about concurrency, cache lines, and the right data structures for the job. If you use Rust at scale, or plan to, you’ll enjoy this.
Setting The Stage
We initially tried debugging the issue by eliminating the obvious causes – watermarking, inaccurate metrics etc.

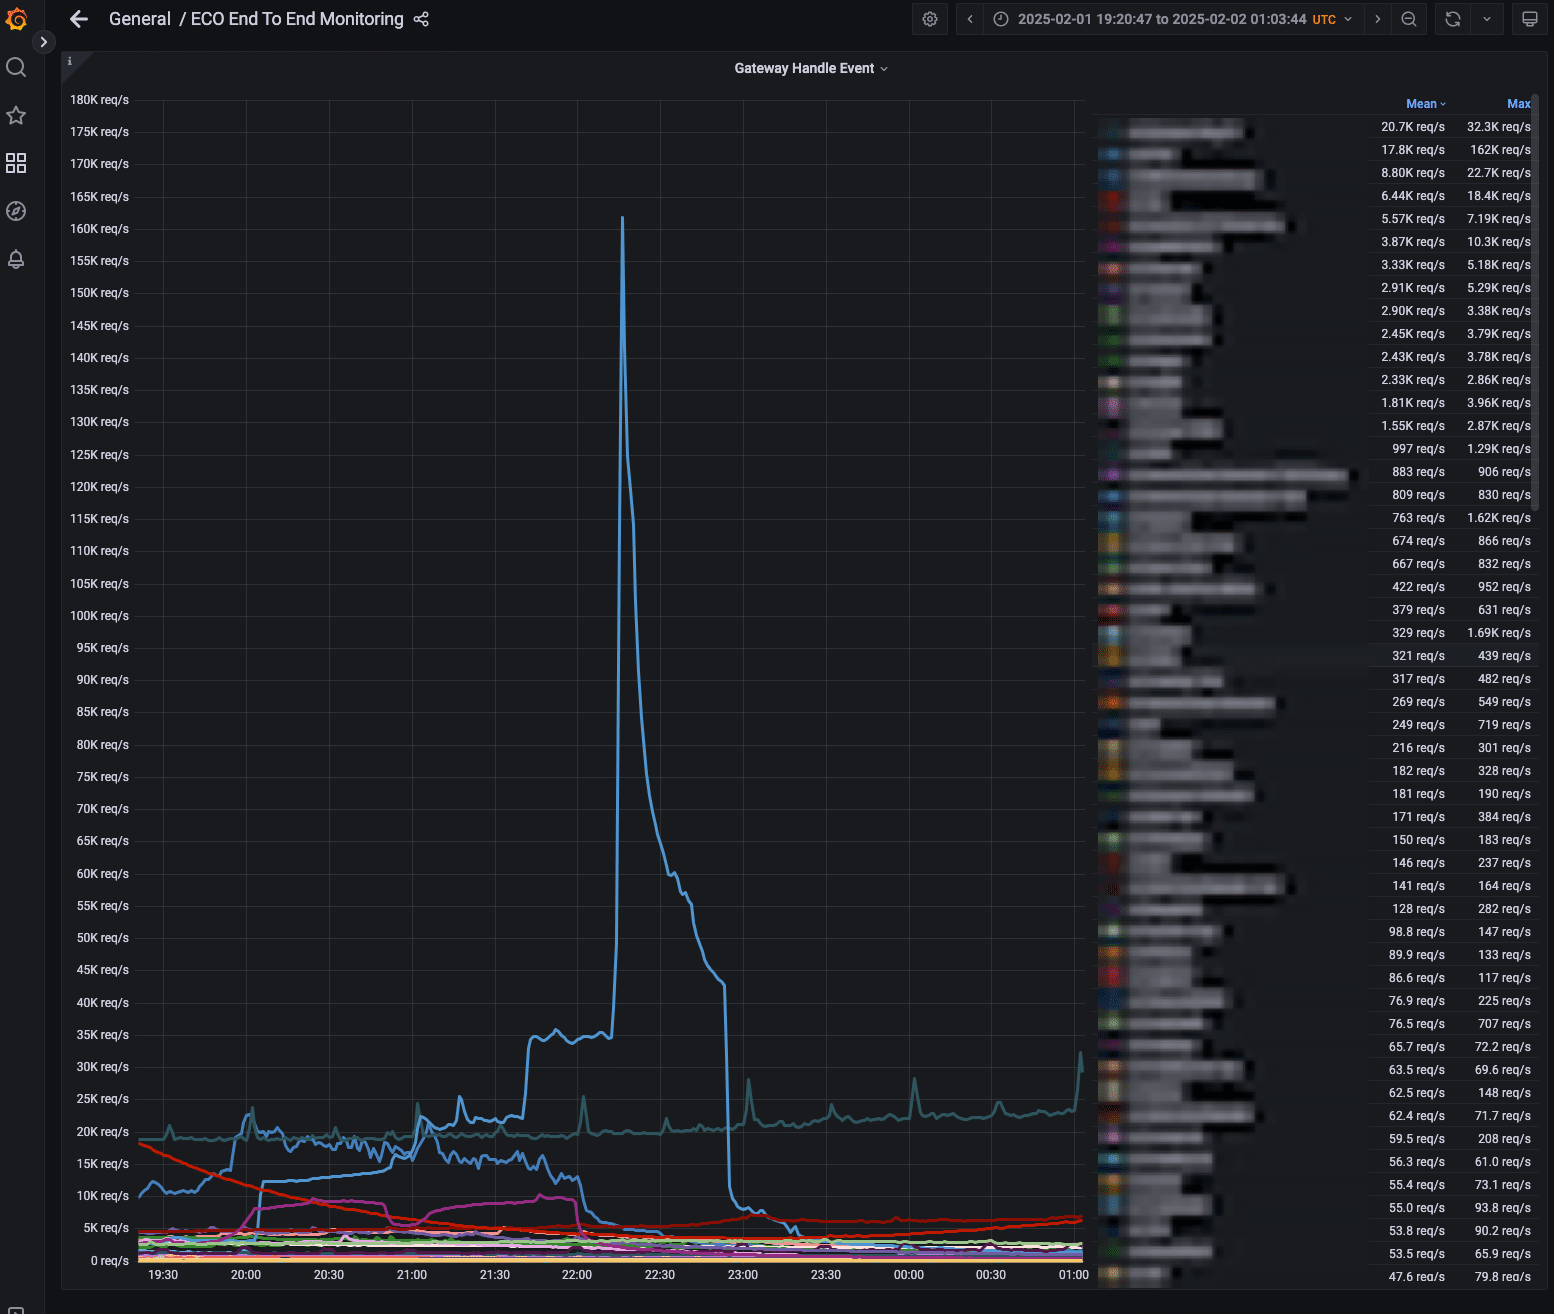
Traffic from gateway showing the P99 latency spike
There was some spirited discussion around whether the way the Tokio runtime was scheduling its tasks across physical threads was causing issues but that seemed improbable given that we use an actor system and each DAG processing task runs independently on a specific actor, and it was unlikely that multiple actors were being scheduled onto the same underlying physical thread.
There were additional lines of inquiry around whether HDFS writes were what was causing the lag to build up and eventually causing a backpressure throughout the system. More analysis of more graphs showed increased context switching during the incident but still with no clear evidence of the cause.
Analyzing The Evidence
We were able to reproduce the issue by saving the event data to GCS buckets and replaying this in an environment enabled with perf. This was a relief because at least the issue wasn’t tied to the prod environment, which would have been a nightmare to debug.
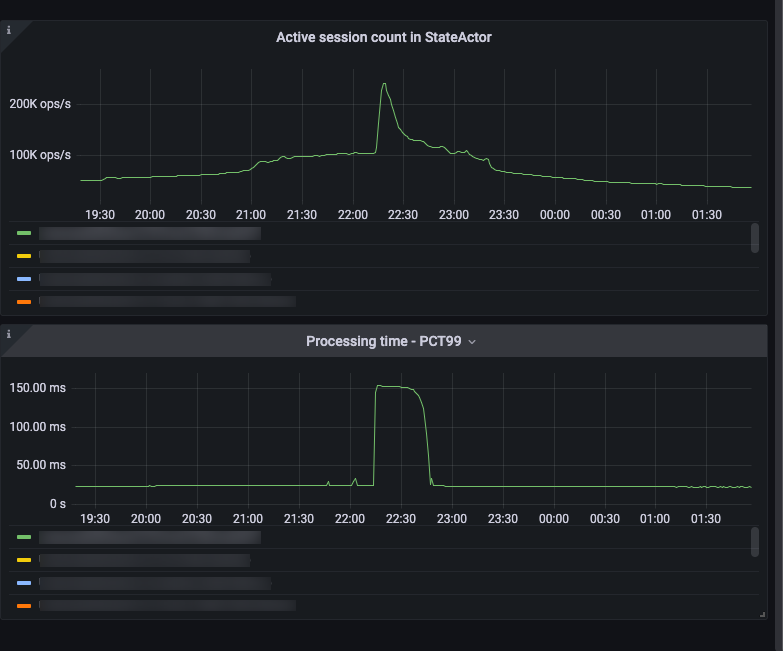
We track active sessions across our system, so we have a reasonable measure of how much load our system is under. However, further analysis in the perf environment revealed that while there was a spike in the number of active sessions, those gradually dropped off while the DAG processing time continued to stay high.

Session count tracker and processing time
While this was still puzzling, at least we had a clear indication of where to look – inside our DAG compiler/engine. All the clues pointed to this as being the source of the issue for the P99 latency spike and the backpressure we were seeing throughout the system.
While we knew where to look, this investigation had already taken weeks and things took a turn for the worse when we hit the issue again on February 23rd. However, there was more evidence coming our way about where to look. All Grafana metrics pointed to DAG processing actually being the cause of slowdown. Another interesting graph that came up was this one displaying the jump in context switches during the incident. While it didn’t lead us directly to the root cause at that point, it became important later on as we identified the issue and resolved it because it tied in neatly with our analysis.

Context switches
Recreating The Crime Scene
Thanks to the earlier work in recreating the issue in a perf environment, we were able to generate these flamegraphs that highlighted hot paths in the code. The first one displays the flamegraph during normal traffic and the second one displays the flamegraph during the incident.
Normal traffic flamegraph
Incident traffic flamegraph
In the incident flamegraph, you can clearly see the dreaded wide bars which indicate longer processing time.
Looking carefully at the flamegraph generated during the incident, you can see a very high load for call paths involving AtomicUsize::fetch_sub which was being called from creating and dropping a ReadGuard in flashmap, which we were using as a concurrent hash map. This concurrent hash map was being used as a type registry which was globally shared amongst all DAG’s across our system.

In the context of this, the earlier graph about the context switches spiking during the incident makes some sense. The ReadGuard in the hot path of the flamegraph was responsible for handling reads from various threads and each thread would increment and decrement the counter.
Now, one important thing about the hashmap in the type registry is that it is almost read-only. It is initialized with some types on start-up and then only updated when a new type is seen but that rarely ever happened. However, on a critical path, it would check to see if the type was already registered which is where the atomic increments and decrements were occurring.
Now, the question was what to do about this. In the flashmap documentation, the performance comparison shows that in the read-heavy scenario dashmap performed better in terms of both latency & throughput. Unfortunately, replacing flashmap with dashmap did nothing to fix the performance problems. In fact, the flamegraphs turned out to be worse in the same situation with dashmap.
Dashmap flamegraph
Finally, we implemented an ArcSwap based solution and the flamegraph improved and the CPU load dropped to 40% in the perf environment.

Post Mortem
So, ArcSwap fixed the problem but let’s look at why it fixed the problem.
First, let’s dig into how concurrent hash maps typically operate. Many designs involve mechanisms like counters to track readers and writers, though the specifics can vary. For example, some implementations use a single, shared counter while others employ sharded designs or multiple counters to reduce contention.
For instance, Dashmap uses a sharded design where each shard is a separate HashMap guarded by a RWLock

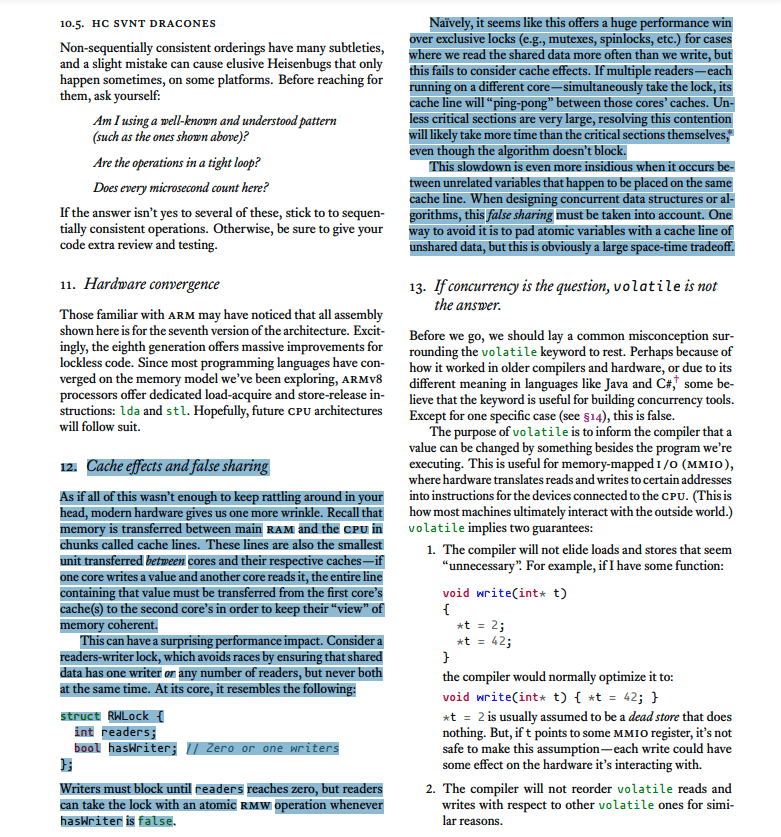
In cases where the data is guarded by a single, shared counter or resides on the same shard, contention can arise under high loads. This is because every CPU core attempting to increment or decrement the counter causes cache invalidation due to cache coherence. Each modification forces the cache line containing the counter to “ping-pong” between cores, leading to degraded performance. To understand this better, look at this section below from a great PDF titled What every systems programmer should know about concurrency by Matt Kline.

This also ties in with the context switching graph we saw earlier, which showed a spike in context switches during the incident.
Note: If you’re interested in understanding more about hardware caches and their implications, look at this post.
Now, let’s contrast this with the approach that ArcSwap uses. ArcSwap follows the read-copy-update (RCU) methodology where:
- readers access the data without locking
- writers create a new copy of the data
- writers atomically swap in the new data
- old data is reclaimed later during a reclamation phase
The ArcSwap repo even has a method called rcu.
This is analogous to how snapshot isolation works in databases with multi-version concurrency control. The purpose is, of course, different but there are overlaps in the mechanism.
ArcSwap avoids cache contention issues for readers that typically crop up when updating a shared read counter with a thread-local epoch counter to track “debt“.
A new version of the data is swapped in using the standard cmp_xchg operation. This marks the beginning of a new epoch, but the data associated with the old epoch isn’t cleaned up until all “debt” is paid off, that is until all readers of the previous epoch have finished.

The big difference between a concurrent hash map and ArcSwap is that ArcSwap requires swapping out the entirety of the underlying data with every write but trades this off with very cheap reads. Writers don’t even have to wait for all readers to finish since a new epoch is created with the new version of data.
Hash maps on the other hand allow updating invidual portions of data in the hash map but this is where it becomes important that we have an almost read-only scenario with a small dataset because the additional overhead of writes with ArcSwap is worth paying here since reads are faster.
Conclusion
Given that we had a situation which was almost read-only with a small dataset, the overhead of a concurrent hash map was not suitable since we had no use case for frequent, granular updates. Trading that for ArcSwap, which is a specialized AtomicRef, something that is designed for occasional swaps where the entire ref is updated, turned out to be a much better fit.


