We have been hard at work building and iterating on new features and platform capabilities to help you get the most out of Conviva. In line with our commitment to keep you in the loop and serve you better, starting from August 24 (today), we will be sending out a monthly newsletter. This will highlight the latest and greatest releases from the previous month, ensuring you can fully leverage the enhanced functionalities of the Conviva Operational Data Platform.
Sit back, relax, and keep reading to learn more!
New: Bar Charts in Custom Dashboards
What: Bar Charts in Custom Dashboards enable faster visual comparison of discrete data sets.
Why: Already incorporated into MetricLens, Bar Charts make pattern and abnormality identification faster, so you can spend more time remediating issues and less time playing Where’s Waldo in your data.

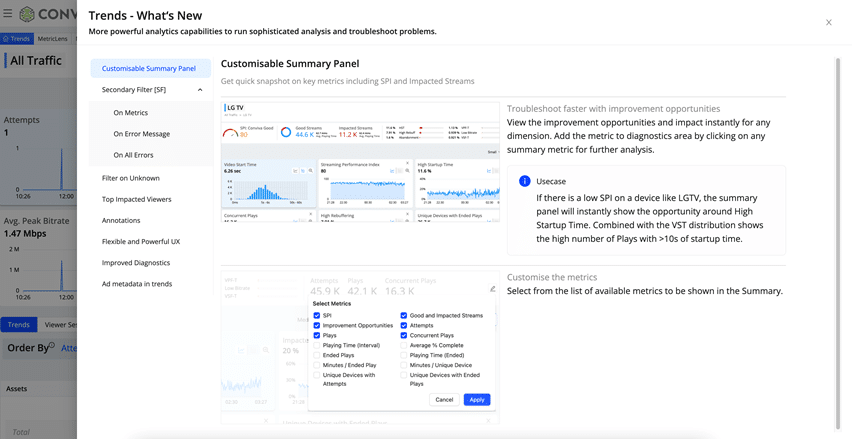
New: Updated Trends Overview
What: Conviva is excited to fully introduce our reimagined Trends Overview in Pulse.
Why: Our new Trends Overview offers more control over how you slice and dice data, enabling you to uncover performance improvement opportunities faster.
(Many of these features were requested by our customers. You asked, and we delivered!)
Some of our new Trends features include:
-
- Customizable Summary Panel: Personalized snapshot of key metrics: SPI, Impacted Streams, and other metrics.
- Secondary Filter [SF] on Metrics: Bringing impacted sessions and impacted devices to the forefront.
- Secondary Filter [SF] on Error Message: Apply filter on VSF/VPF error message.
- Secondary Filter [SF] on all Errors: One-click shortcut to apply Secondary Filter [SF] on all errors.
- Filter on Unknown: Drill-down on the cause of missing values and discover more data wherever needed.
- Improved Diagnostics Workflows: Display all AI alerts and/or manual alerts events as annotations directly in Trends.
- Top Impacted Viewers: Enable proactive customer care and go straight to outliers.
- Annotations: Note important changes/events affecting QoE and/or engagement metrics.
- Flexible and Powerful UX: Create personalized views for your unique use-case with save and share capability.
- Presets based on Trends: Off-the-shelf views which can be customized for easy saving and sharing.
New Metric: Exit During PreRoll (EDPR) for Client-side Ads
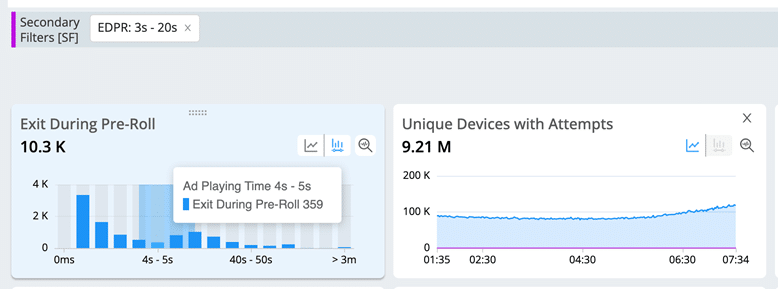
What: EDPR is a new metric designed to refine ad strategies, highlighting changes in ad engagement, and improving the overall pre-roll ad user experience.
Why: This new metric enables publishers to find the right balance between ad pod duration and frequency of ad breaks so they can optimize for maximum revenue.
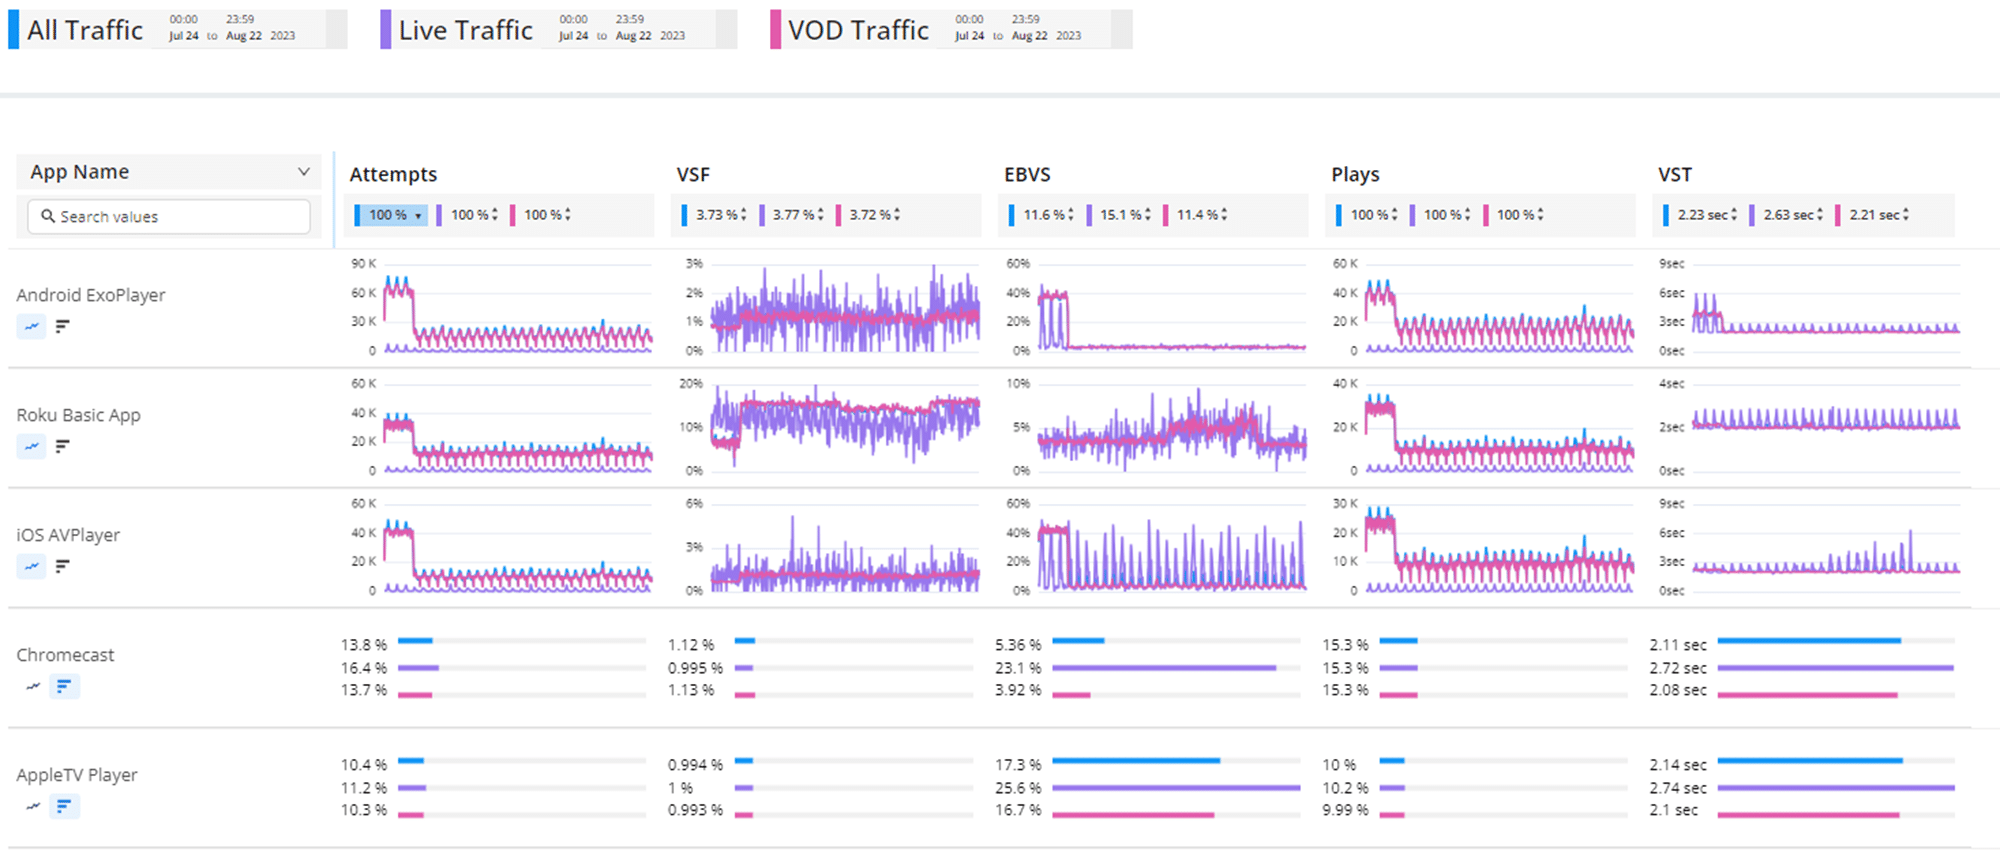
MetricLens Now Supports Multiple Time Series Visualizations
What: Pulse users can compare up to 10 attributes in a time series visualization using MetricLens.
Why: By plotting multiple attributes on a time series, publishers can visually determine if an issue is isolated to a single attribute, such as an Android device, or if its present across a range of devices and correlated across a specific time period. This new ability makes it easy to do a range of analytic workflows, including A/B testing.
Ad Metadata in Trends
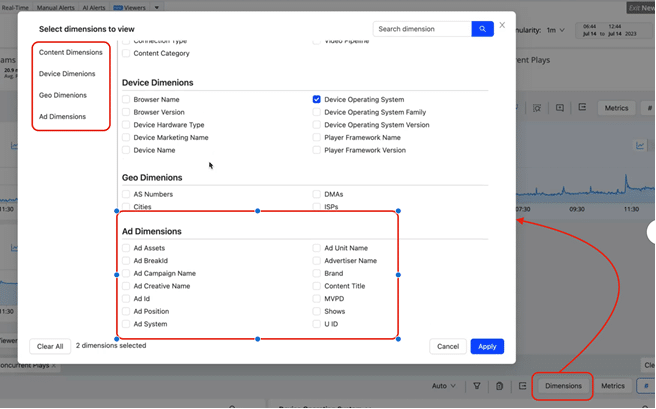
What: Customers who have bought Ad Experience can now toggle a variety of ad dimensions within their Trends Overview page, rather than switching between multiple UI.
Why: By integrating Ad Experience into Trends, Conviva provides publishers with a more efficient way to measure how content and ads work together to affect viewer experience.
