This week, Henry Milner, a principal engineer at Conviva presented our paper: Raising the Level of Abstraction for Time-State Analytics With the Timeline Framework at the Conference on Innovative Data Systems Research (CIDR) in Amsterdam. CIDR is the premier venue in data systems research to inform the next frontier of data processing which “ .. encourages papers about innovative and risky data management system …., and provocative position statements … presents novel approaches … to inspire discussions on the latest innovative and visionary ideas.” This article will share what this “risky” and “provocative” Time-State Analytics and Timeline Frameworks are, and why the community is excited about them.
Introducing Time-State Analytics
Let me start with some typical data analysis Conviva runs to support leading video streaming providers. Our customers care a lot about video buffering as it impacts user experience. To this end, they monitor “connection-induced rebuffering” to inform operational decisions, e.g., which users are suffering and how do we remediate them. A common query is: “How much time did a user spend in connection-induced rebuffering while using Content Delivery Network or CDN C1?”
While this intent is easy to state, computing such a metric at scale over raw measurement streams is certainly not. This query involves stateful and context-sensitive analysis over continuous time. That is a mouthful, so let me deconstruct it using the example in Figure 1.
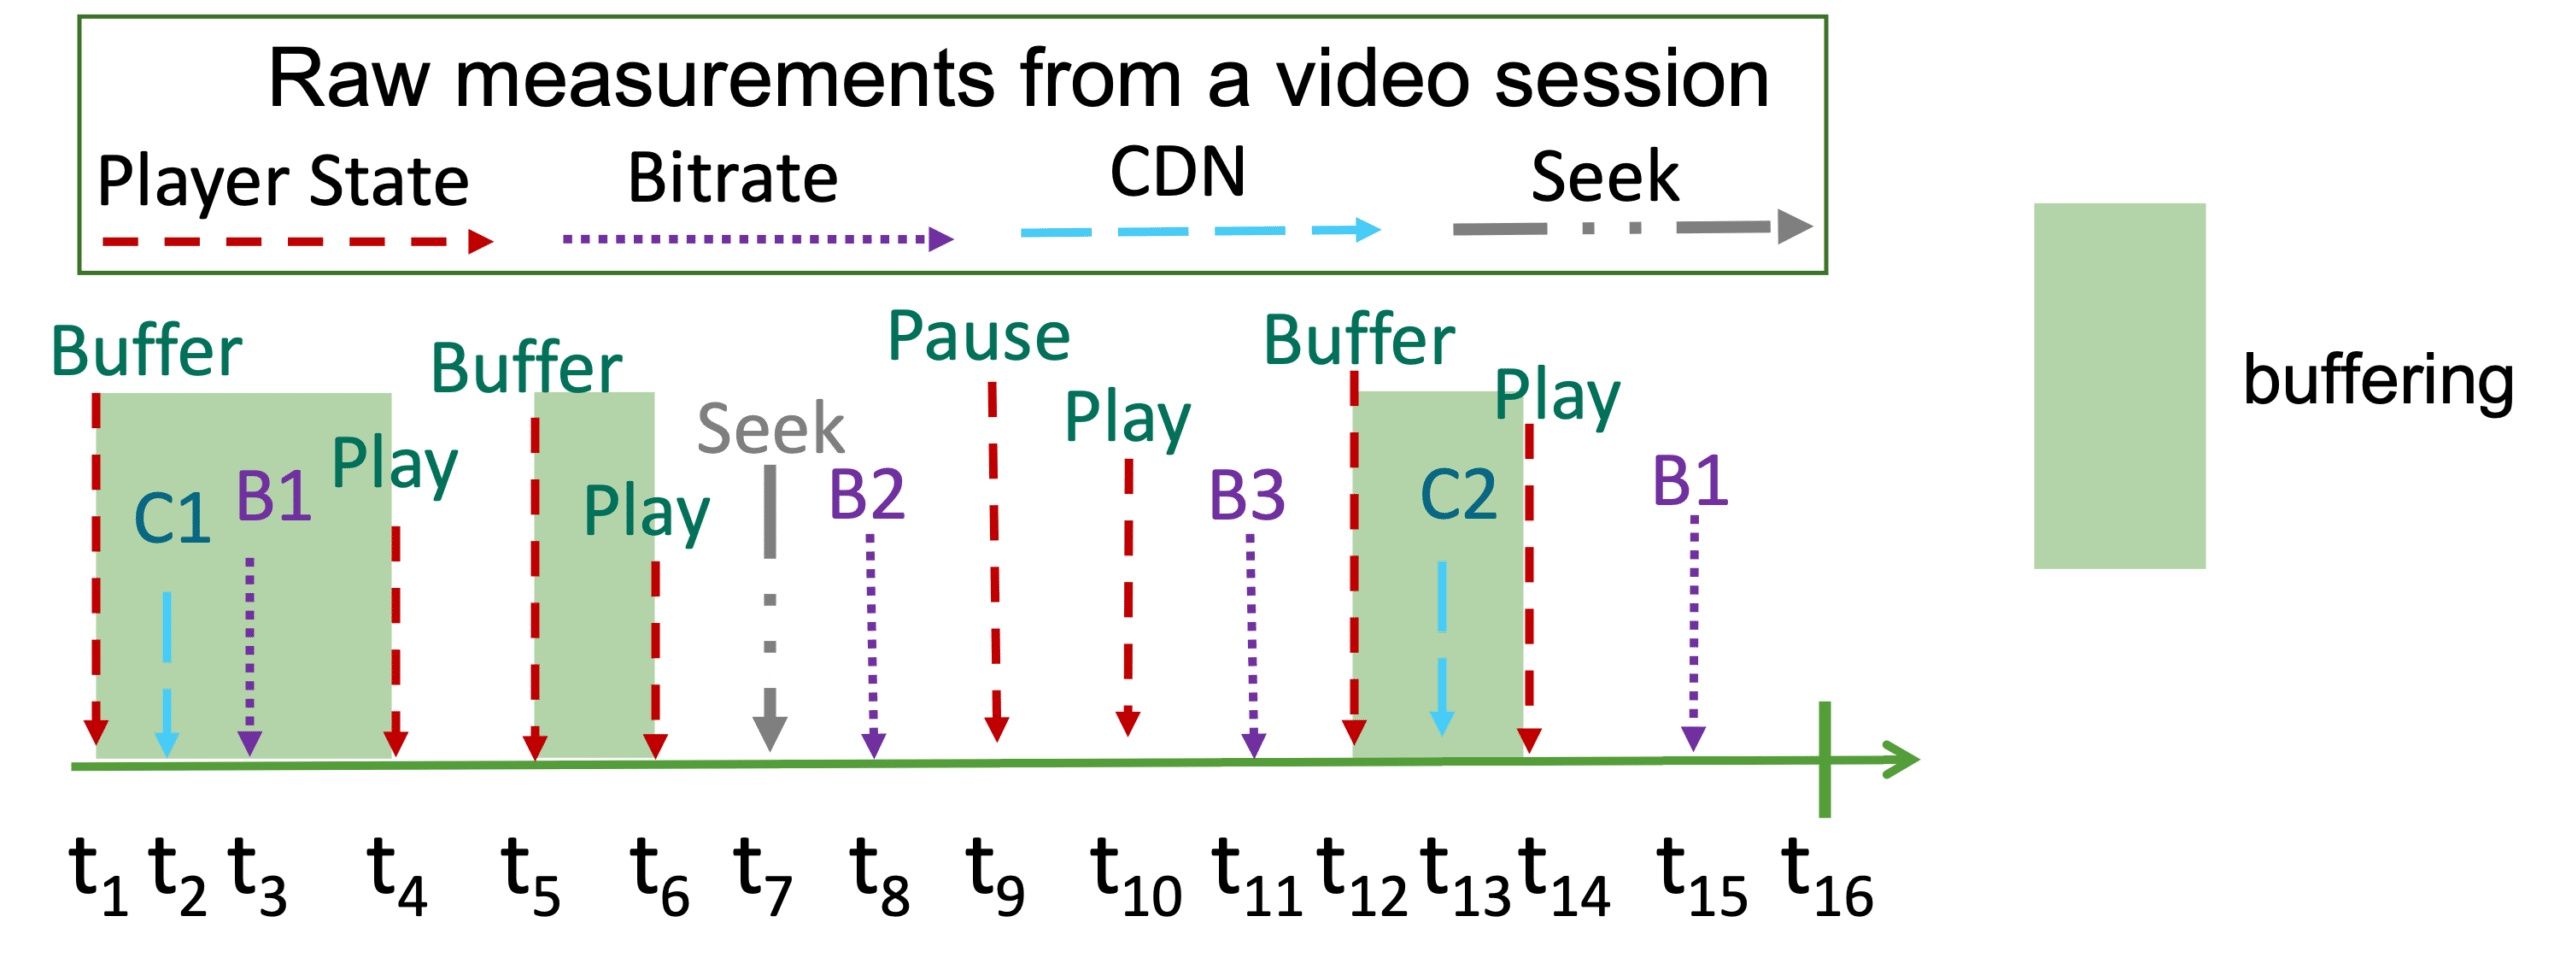
Figure 1: A sequence of player events reported from which we need to compute rebuffering to inform real-time decisions for CDN selection.
- Stateful: We need to reconstruct the state of the video player from this event stream, e.g., when was it in initialization vs. play vs. buffering, when was it using different CDNs, and so on.
- Context-sensitive: We need to consider the context of other actions and history, e.g., not include time spent buffering during initialization or just after a user seek.
- Continuous time: We need to not only capture “events” but model continuous intervals, e.g., ignore buffering occurring within 5 seconds of seek.
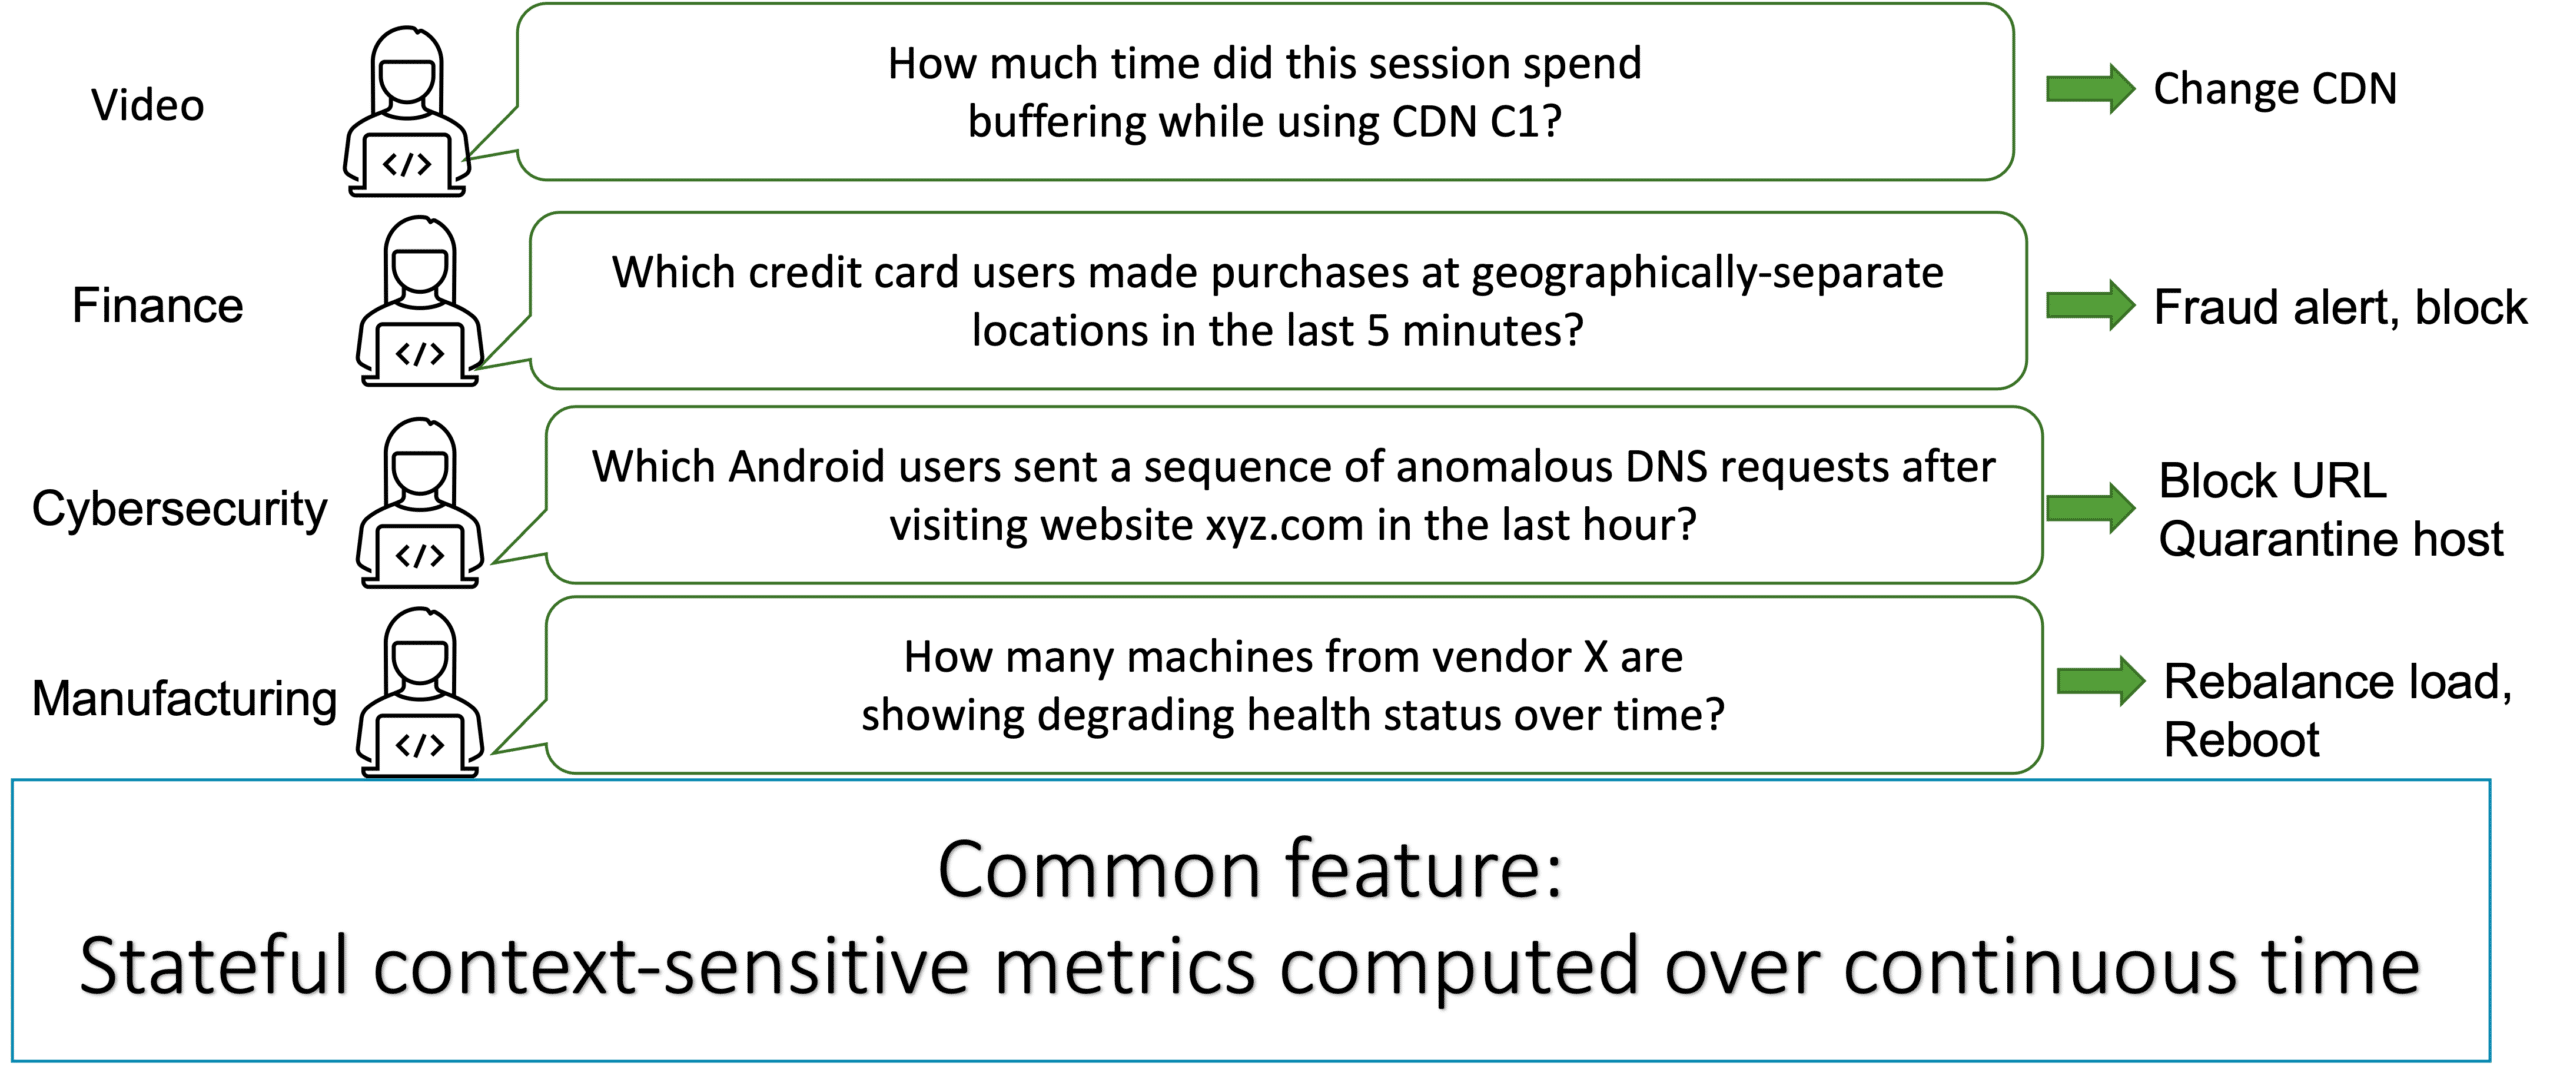
Figure 2: Many domains of Big Data processing require stateful context-sensitive “Time-State Analytics” capabilities for driving operations.
We refer to these kinds of queries at Conviva as “Time-State Analytics.” These stateful context-sensitive analysis (over event streams with continuous time semantics) are in sharp contrast to traditional database queries that only need simple filter and aggregate operations over tabular data (like a spreadsheet). Capturing these kinds of metrics precisely and in real-time are mission critical for driving our customers’ operations.
Now, if you’re wondering if these kinds of queries are critical for operations in your domain too, the answer is a resounding yes! Time-State Analytics pervades all domains of everyday life. Think about monitoring baggage delays in airline apps or food delivery tracking in app-based ordering (Apps); monitoring a user’s transaction journey to detect credit card fraud (Fintech); flagging computers for signs of intrusion (Cybersecurity); monitoring devices in the field to track their health (IoT); and many more.
All these examples involve modeling the “stateful” evolution of some real-world phenomena (e.g., user behavior, baggage status), over “continuous time” (e.g., within the last ten seconds) and carefully measured in the “context” of other events in that event stream (e.g., after clicking, after ordering).
Key takeaway: Many domains require new “Time-State” analytics queries. They entail stateful, continuous time, and context-sensitive processing of large-scale event streams to drive technical and business operations that are not well served by traditional data processing.
Time-State Analytics needs a new data processing solution.
Even though Time-State requirements are pervasive, the ugly truth is that these are incredibly hard to implement. Why? Using traditional data processing systems involves high development effort/complexity and entails poor cost-performance tradeoffs at scale.
Conviva has more than 15 years of experience using state-of-the-art Big Data technologies (e.g., Hadoop, Apache Spark, Spark Streaming, Apache Druid) to serve its customers data analysis requirements. Using traditional database and streaming abstractions has consistently failed us in supporting Time-State Analytics queries, with respect to high development efforts and poor performance.
The root of this problem is that existing data processing systems (RDBMS, Streaming Systems, Timeseries databases) are based on a tabular model: either one row per measurement event or one row per discrete timestamp, with more columns indicating the measurements we received.
Unfortunately, the tabular model and relational algebra that back it is a poor basis for stateful, context-sensitive, continuous-time calculations. They do not support natural operations for these. Thus, we end up with hack-ish and unreadable code like what is shown in Figure 3. Even as the designers of this query, we still need to stare at this for a while just to understand it. So, when our developers must write code like this for hundreds of metrics for customers, it involves long development time and the need to avoid many subtle bugs.
Furthermore, it’s also bad for performance. It is hard for a query engine to extract structure from such complex queries to apply optimizations. The consequence is running such a query at scale can result in high cloud costs.
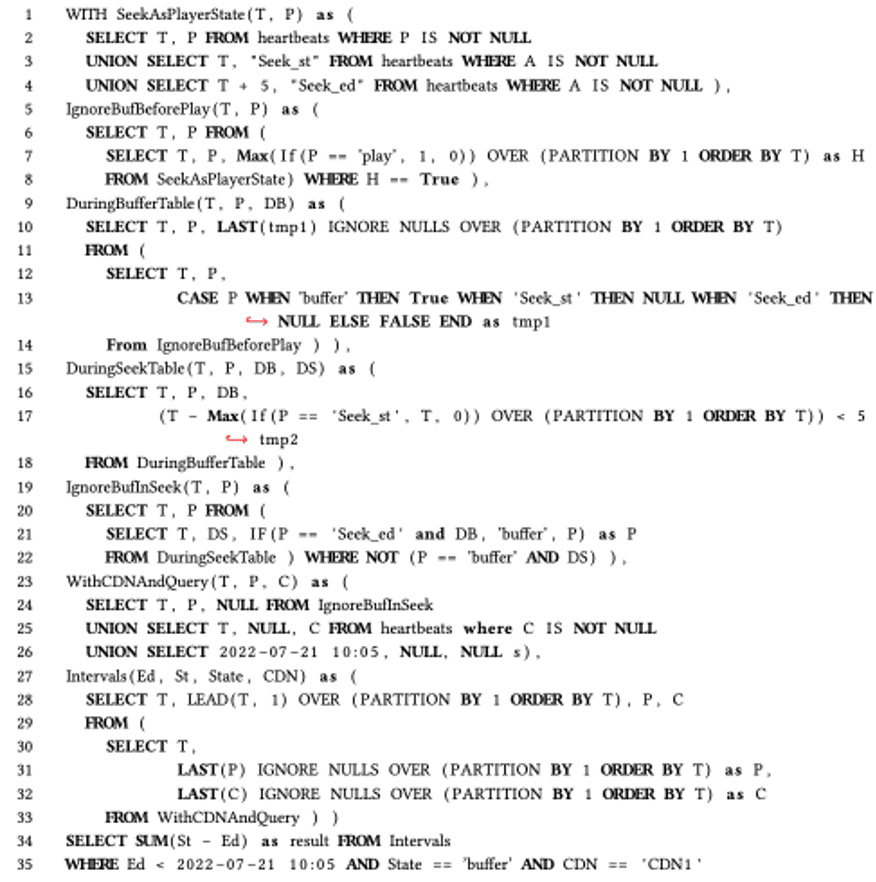
Figure 3: Complex and unnatural query we need to write to express rebuffering calculation over a tabular abstraction.
Key takeaway: The consequence of using a tabular/relational abstraction for Time-State Analytics is high development effort and buggy/hard to reason code, and low cost/high performance at scale.
What is the Timeline framework?
“Geometric abstractions are powerful tools” – Fred Brooks
When we have what seem like fundamental problems, it’s helpful to think from first principles. Let’s imagine we did not have to move to a tabular model and think about what we would have done on a whiteboard. Intuitively, we wouldn’t go create a table. We would instead try to visualize the events by drawing them in a timeline, just like I’ve shown here.
Then, it would be very natural to graphically plot the player state over time. For example, the player state was Buffer for a while, then Play when we got a Play event, then back to Buffer, and so on. It turns out this is a simple ‘fill forward’ operation, which we call LatestEventToState, to get a step function of the PlayerState at each point in time.
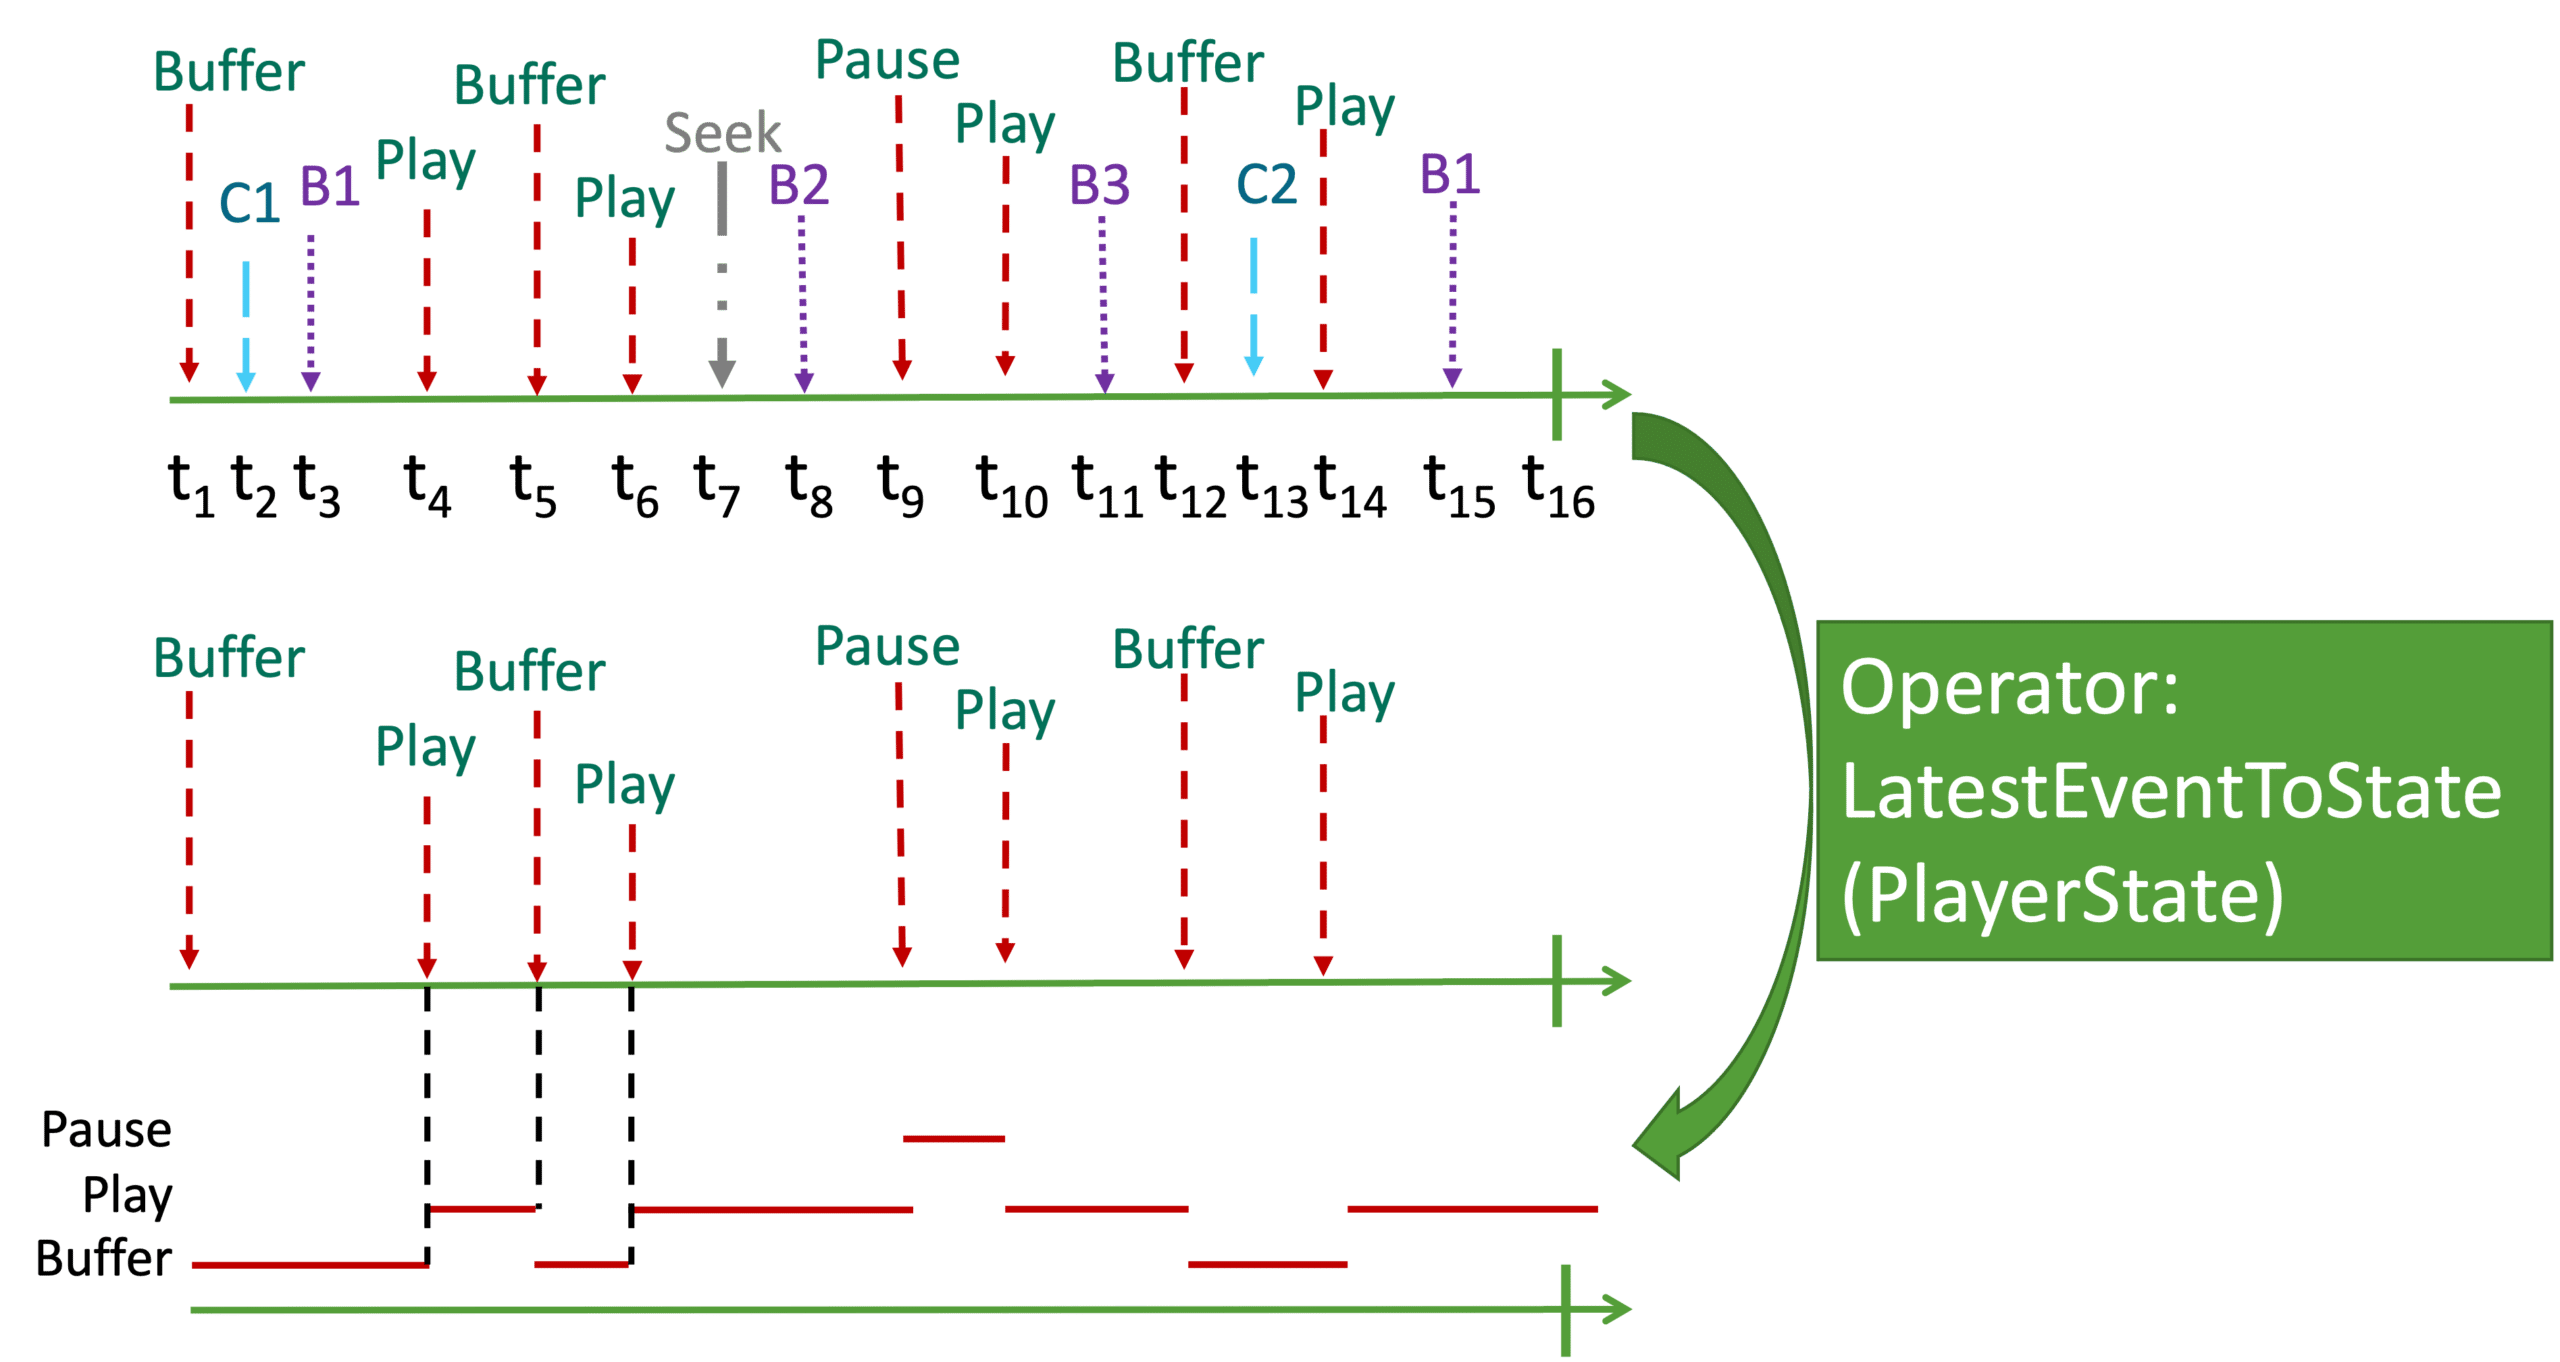
Figure 4: A geometric or visual way of tracking events to model the player state.
Fast forwarding a bit, we will whiteboard the metric as a sequence of geometric manipulations over these timeline constructs. Each of these steps becomes a simple geometric manipulation in what we call the Timeline Algebra. These are intuitive operations in our Timeline representation but would be tedious to express in traditional relational algebra based on a tabular model. Revisiting our example, let me show you how this plays out (Figure 5). First, we figure out which of the buffering is induced by a connection rather than say init or user seeks. In parallel, we need to logically intersect this with “CDN state” of the player C1 or C2. And then we need to add up the duration.
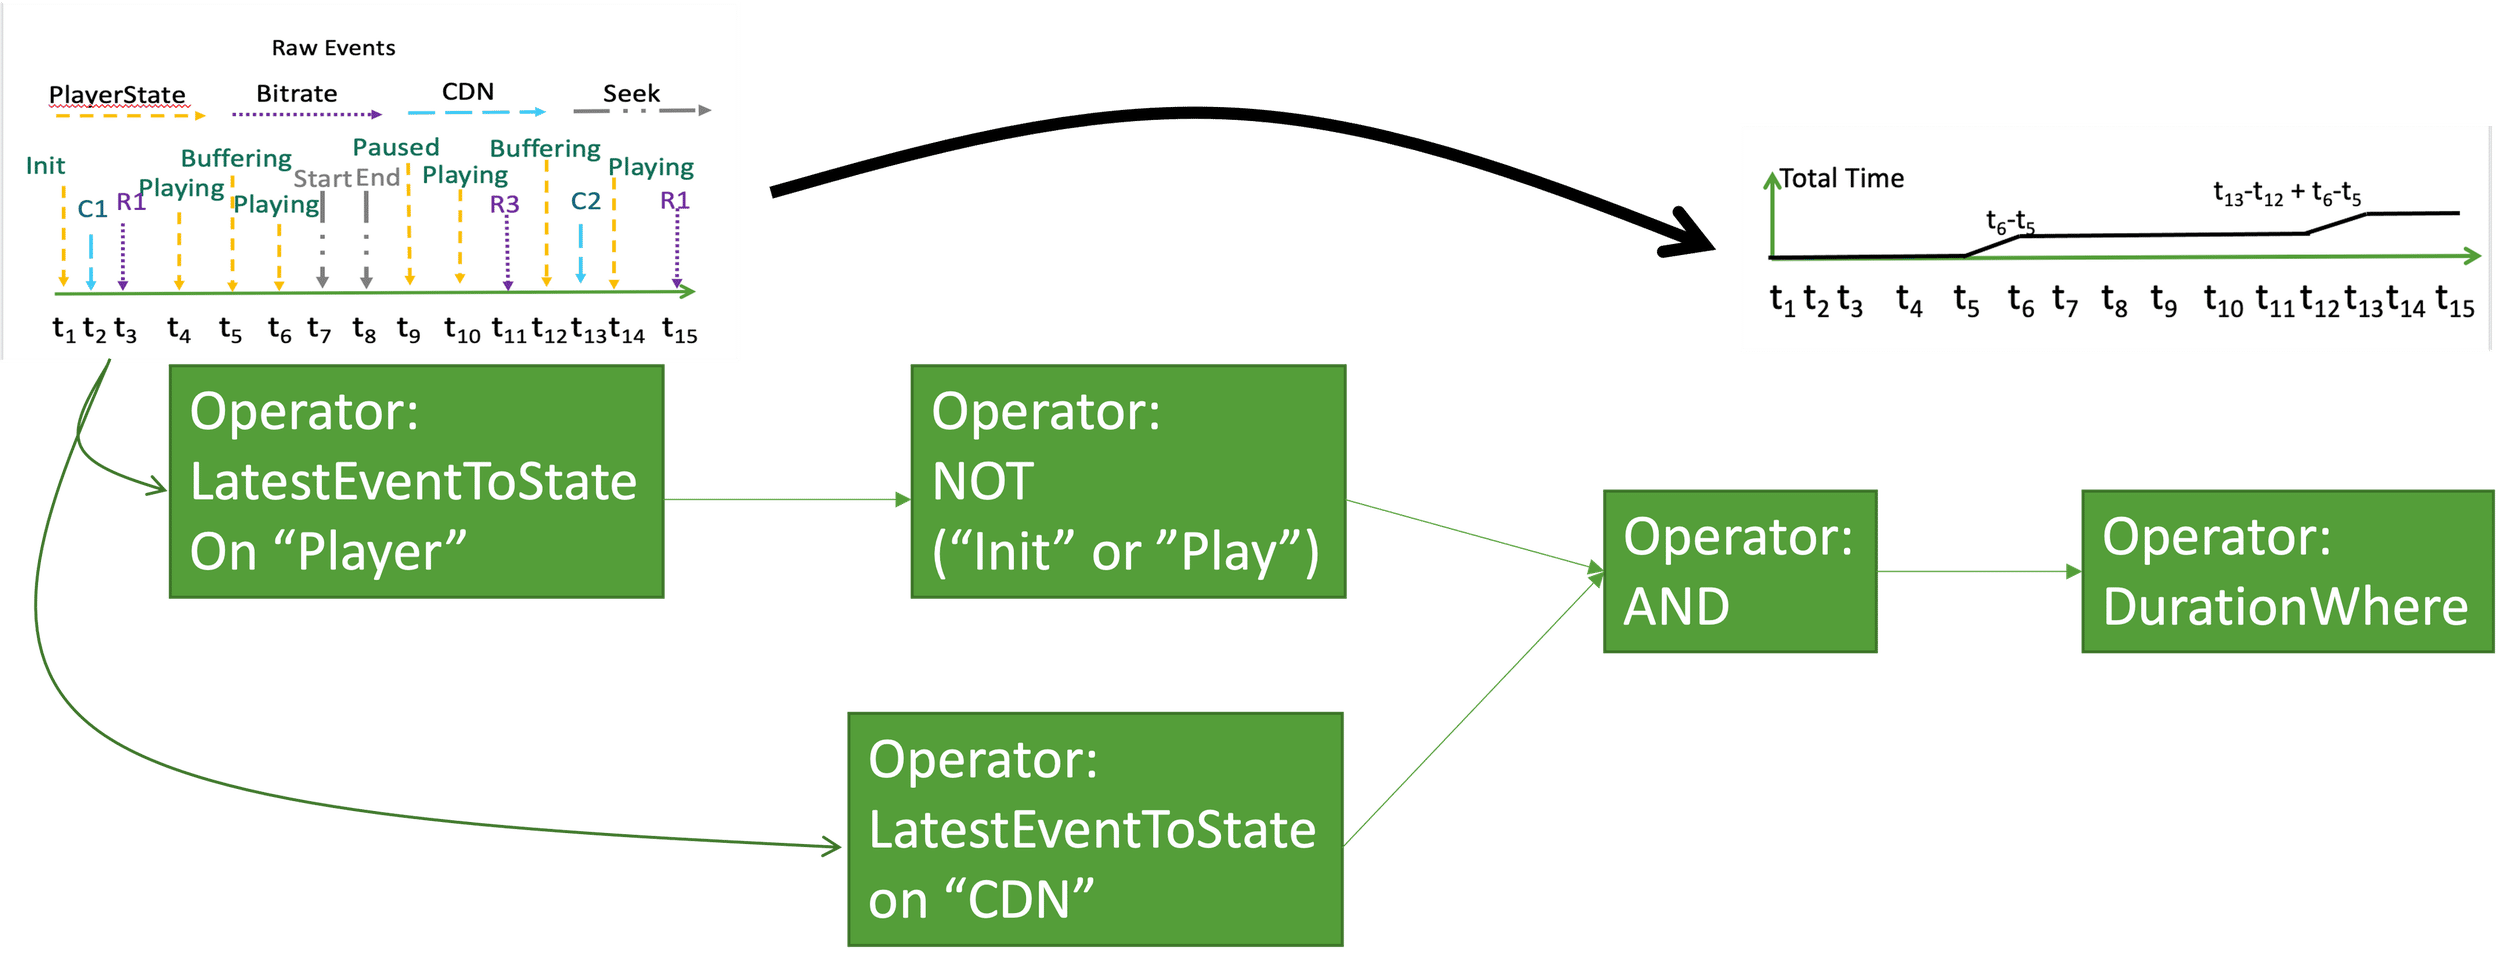
Figure 5: Our rebuffering query expressed as a simple and intuitive “DAG” of Timeline operators.
Here is another way to see the intuition of Timelines. Imagine we had a massive table of columns of measurements in a very high time resolution. Equivalently, we can view each measurement not as a column but rotate the column and visualize the dynamics over time. So M1 becomes a step function, M2 becomes a discrete set of events, M3 becomes continuous varying over time, and so on. These are our basic Timeline Datatypes. And they turn out to be surprisingly general to capture real-world dynamics. As we saw above, a query to model a new metric is just a series of manipulation of such Timeline data objects.
In a nutshell, the Timeline framework thus consists of:
- Three basic data types capturing basic forms of temporal dynamics (Event, Values, States);
- Geometric operators that transform and manipulate Timeline data objects; and
- A simple DAG-based compositional language for expressing end-to-end queries
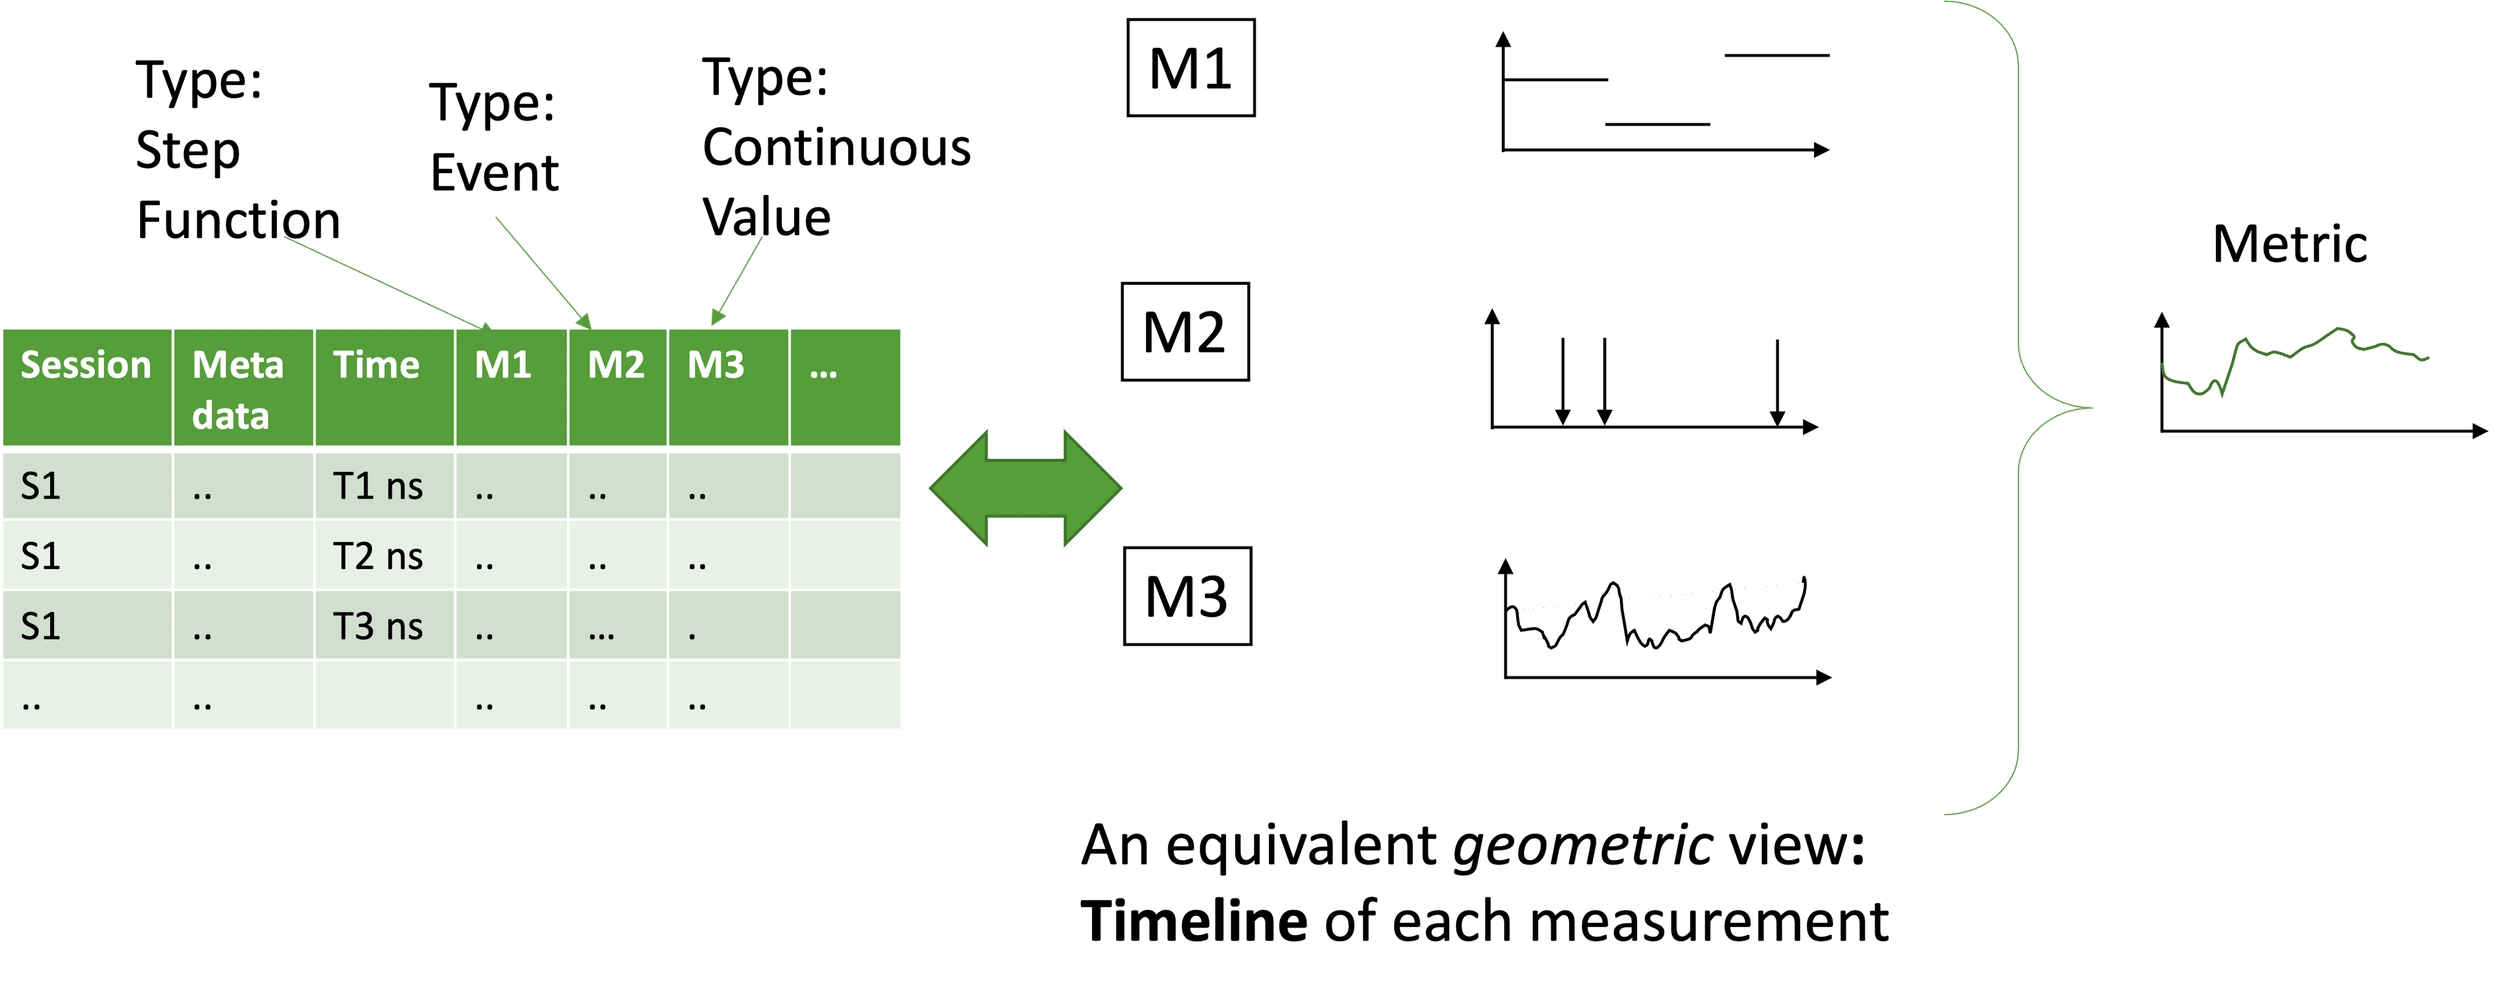
Figure 6: An equivalent geometric view of a hypothetical infinite-row table of temporal measurements reformulated as a timeline per measurement column.
Essentially, Timeline raises the level of abstraction to express query intents for Time-State Analytics using a natural geometric mental model rather than contrive to write them in a tabular model. Stepping back, we believe the Timeline framework is powerful because it has a geometric or visual basis! To paraphrase from Fred Brooks seminal paper, systems work when designers can visualize layouts and identify problems. In contrast, software is hard to visualize, and this hinders design. While Brooks is right in general, we have identified an elegant geometric Timeline abstraction for Time-State Analytics that dramatically reduces complexity!
Key takeaway: The Timeline framework raises the level of abstraction for Time-State Analytics using a geometric basis of data types, operators, and composition logic.
How is the Timeline framework better than the status quo?
An elegant idea isn’t useful without real-world value. The ultimate value of the Timeline abstraction is two-fold:
Reduced effort and bugs: First, using Timelines dramatically reduces the development effort.
Figure 7 shows a cleaner Timeline based refactoring of a SQL-like query. Compared to the SQL code, it’s shorter. More importantly, it’s easy to write it and understand what it’s doing. With our previous stack, it took weeks for a new developer to create a metric, and there were lots of subtle bugs. With the Timeline abstraction, onboarding time dropped from weeks to days, and we also saw the rate of semantic bugs drop by 80%.
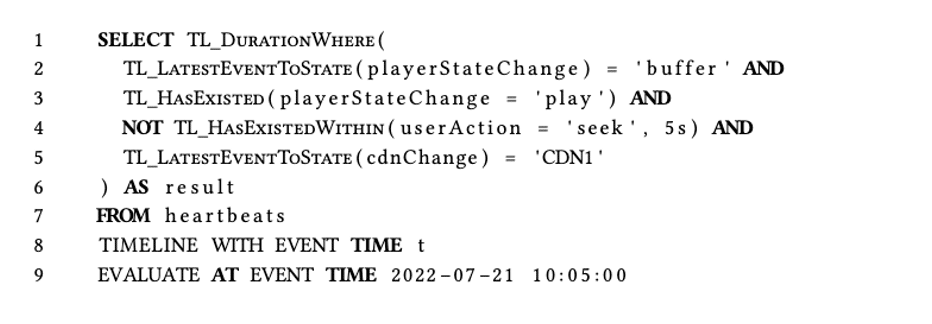
Figure 7: A hypothetical “SQL” like query equivalent to the Timeline DAG above.
Improved cost-performance tradeoffs: Second, by exposing structure, we can also dramatically improve the performance. Since we know the temporal and type structures of the TimelineTypes we can use more natural encodings. Given such data structures, we can implement semantic-aware operations efficiently.
We are just getting started and already finding significant (up to 10X) wins in execution time over prior approaches (Figure 8).
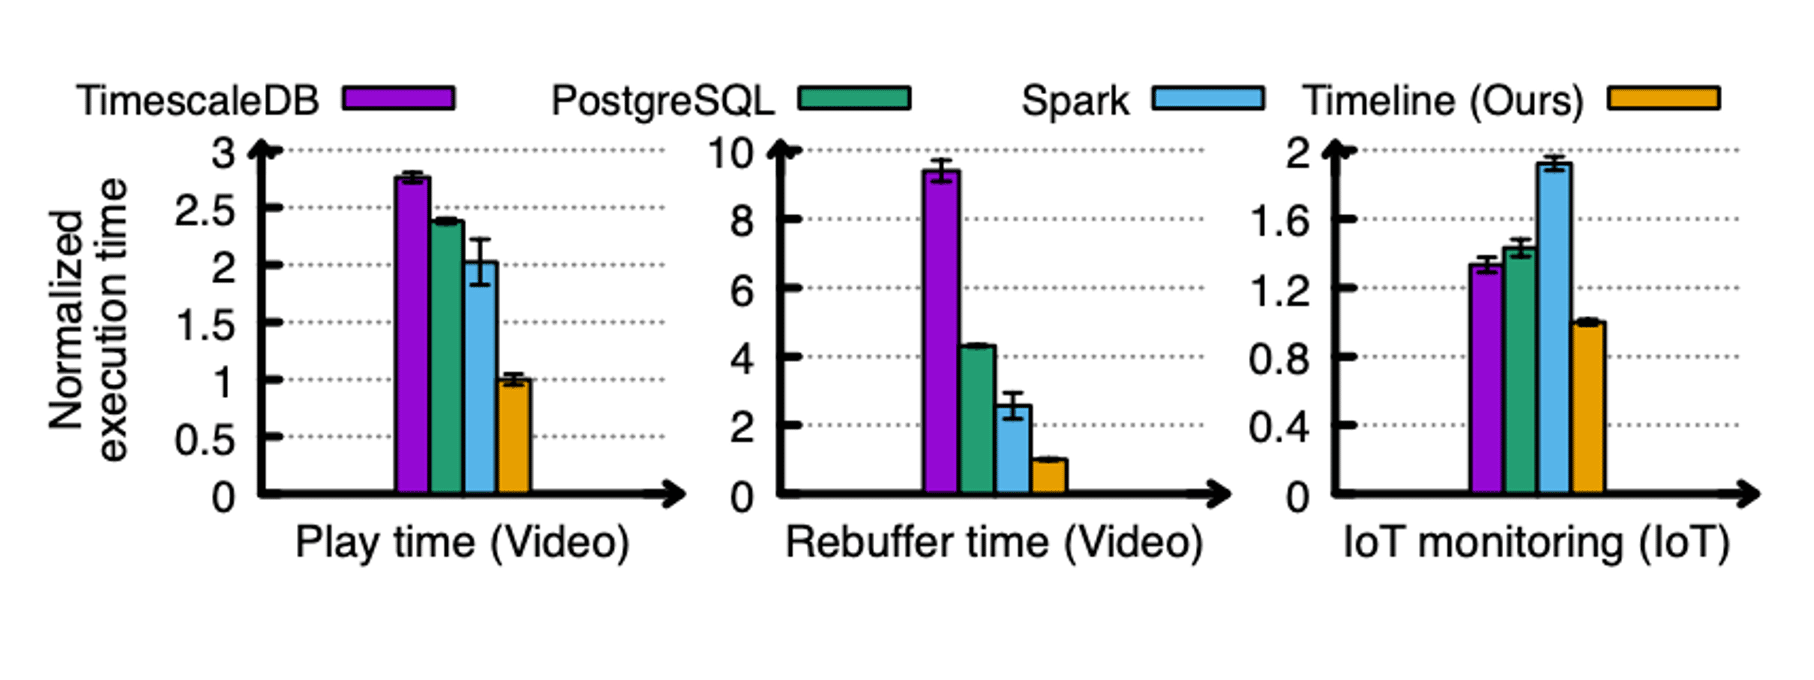
Figure 8: A simple batch-mode benchmark comparing Timeline-based computations vs. canonical approaches.
Key takeaway: Raising the level of abstraction reduces developer effort, bugs, and cloud costs by (up to) an order of magnitude compared to state-of-art solutions.
What comes next?
Timelines represent a very rare trifecta of: (1) research rigor and elegance; (2) an intuitive mental model to boost developer productivity; and (3) dramatic improvements in cost-performance tradeoffs. Looking forward, we’re excited to see new avenues that the Timeline framework opens up. These include:
- Broader ecosystem adoption: We believe that the Timeline APIs can be plugged into other data processing pipelines (e.g., Spark, Streaming SQL) with a few extra lines of code.
- Applications to other domains: While our use and early wins have been in video analytics, we posit that the Timeline abstraction has broader applications. An interesting direction is exploring how the Timeline framework can be extended to support future domains.
- Democratizing complex data analysis: Since Timelines have a geometric or visual basis, they can enable new types of visual or graphical query interfaces. They lower the barrier of entry to express complex analysis and make the benefits of Timeline available to non-programmers.
- Even better performance: We also envision even bigger wins by exploiting structure-aware and cross-query optimizations that Timelines can enable.
Watch this space to learn more about Timelines and Time-State Analytics and the exciting developments Conviva has in the pipeline!
Introducing Vyas Sekar, an Interview with Conviva’s New Chief Scientist
Read More
Raising the Level of Abstraction for Time-State Analytics With the Timeline Framework
Read More


