The video streaming market continues to grow by leaps and bounds. A recent report by Allied Market Research indicates that the value of the international video streaming service will be near $150 billion by 2026. For service providers, this prediction presents a tremendous potential for revenue growth. It also poses tremendous challenges. This is because today, as a streaming service provider, quality of experience (QoE) is the deciding factor between having a successful streaming business or not.
Quality of experience (QoE) during every video stream is now even more critically important as competition in the streaming industry continues to heat up. Time after time, Conviva data speaks to the fact that viewer engagement drops as QoE deteriorates. Continuous performance improvement is crucial to retain viewers and keep them coming back to a video streaming service.
How Quality of Experience Impacts Engagement
The principal business objective for most video streaming service providers is to grow and retain their audience over time. The quality of experience on a platform impacts a viewer’s perception and engagement with the brand, impacting the entire business model.
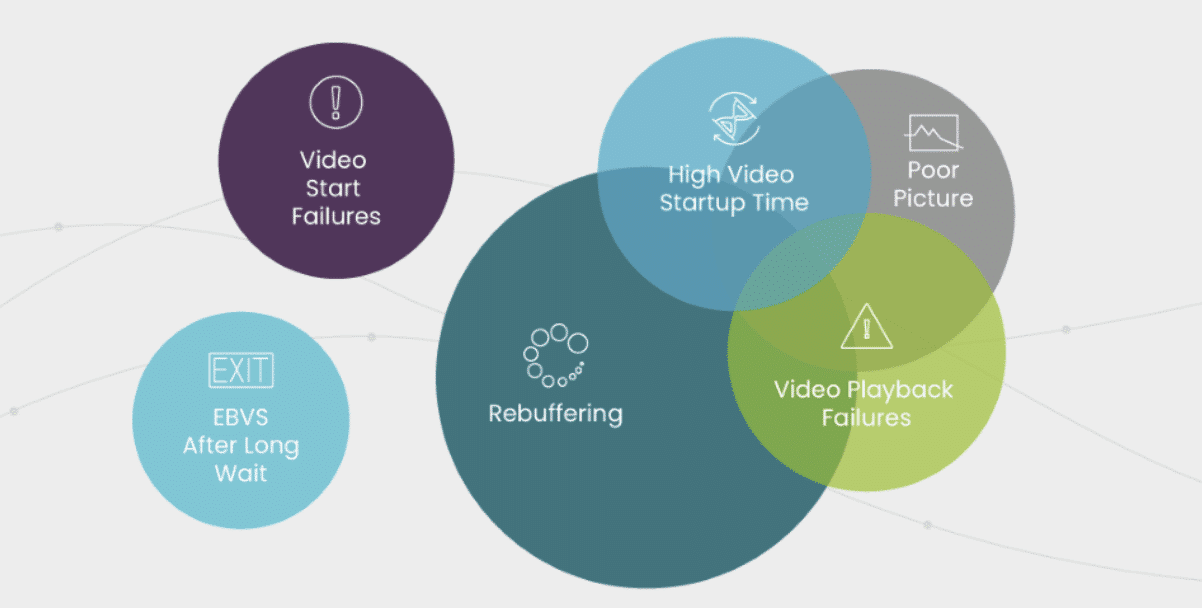
Several metrics are critical indicators of video quality. They are essential to take notice of when measuring viewer experience. What are all the things that can go wrong when a viewer hits play? The graphic below shows how the different video streaming quality issues across different metrics can fall short of the professional quality the viewer has seen in the past.

Ultimately, it can be hard to look across each of these metrics and understand if your platform provides optimal video quality that meets user expectations.
Conviva’s KPI
That’s why Conviva has the KPI: The Streaming Performance Index (SPI). We can translate all critical measurements into video streaming that is a pleasure to download and view.
An optimal streaming experience has no video failures, starts playing quickly, and delivers high picture quality with no rebuffering. Conviva’s SPI is based on the percentage of streams that meet the following standards:
- No video start failures and video playback failures
- No perceivable connection induced rebuffering
- High picture fidelity measured by bitrate threshold set based on-screen type.
- No exits before the video starts after the viewer has waited a significant amount of time before abandoning.
- Acceptable video startup time
Conviva’s Executive Email 2.0
To help customers make maximum use of SPI, Conviva is introducing The Executive Email 2.0. The Executive Email 2.0 provides a comprehensive explanation of the SPI. These experience insights include how a publisher performed against the industry, how top devices performed, and what caused poor performance across some streams. This new tool will enable organizations to track progress in video delivery improvement, share performance with stakeholders that aren’t necessarily users of the Conviva dashboard, and flag areas of underperformance in which to invest.
Key components of the Executive E-mail 2.0’s SPI insights include:
Streaming Performance Index with industry benchmark to give a clear view of QoE:

Understand what issues contributed to poor user experience:

Compare SPI across platforms with device breakout:

Use the Conviva dashboard to investigate issues flagged in executive emails.
In this example, LG TV SPI is significantly below other devices. Below we are using Conviva’s Pulse 5 dashboard to understand that video start time is the main issue:

Drill down into LG TV distribution metrics to understand impact:

Performance Benchmarks

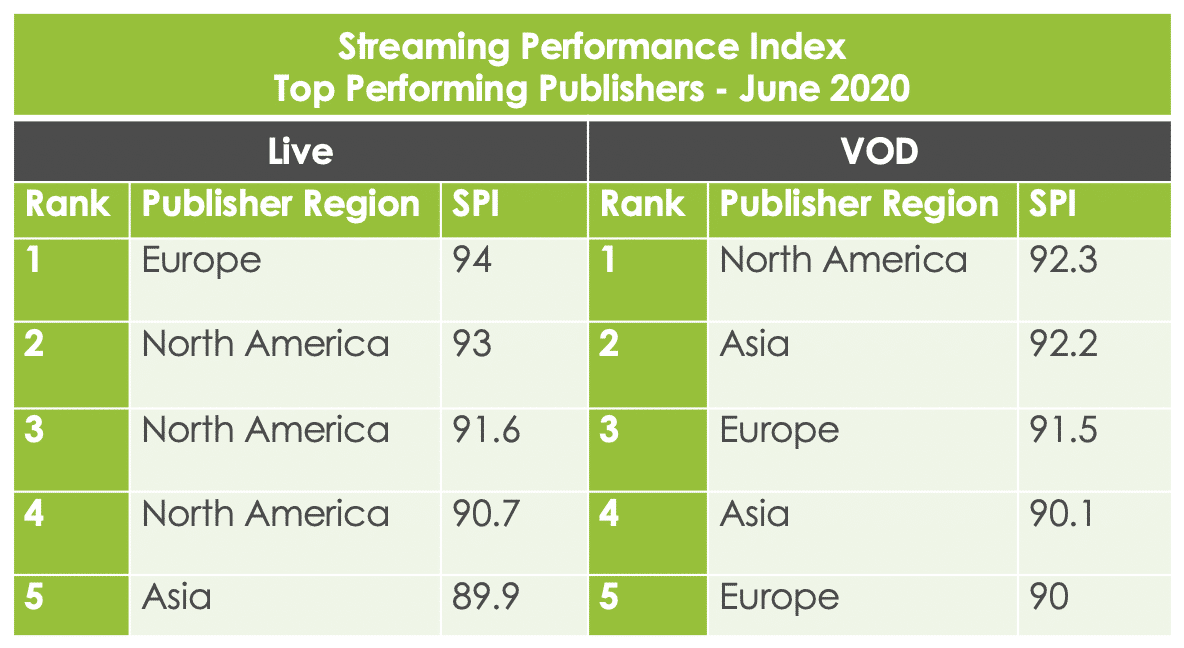
Want to understand the impact of SPI on viewer engagement? How many hours of viewing are you missing by not increasing your score? Check out Conviva’s State of Streaming to learn more about the metrics right now in your area and how your score compares to others around the globe. Our specialists are available to answer any questions. Contact us today.


