


Today we are thrilled to announce that our Experience-Centric Operations (ECO) service is generally available to all our customers. With this GA release, Conviva becomes the first and only platform to monitor and manage quality of experience in real time at scale to drive business outcomes.
Quality of Experience matters in every industry, from Media & Entertainment to Gaming, to e-Commerce, to Travel, and more.
In this blog, we explore why organizations need to focus on Quality of Experience (QoE), using Media and Entertainment as an example. And we will introduce ECO, a core service of Conviva’s Operational Data Platform, that enables our customers to optimize every user experience in an application in a quantified manner in real-time.
Why Quality of Experience Matters
Across our data, we see that a mature video publisher will lose 1.7M subscribers a year due to unresolved QoE issues. While outages happen infrequently (maybe up to 3 times per year for any publisher) and impact 25+ million viewers, QoE issues happen 24/7/365 and can impact 189 million viewers per year per publisher. Conviva places Quality of Experience at the forefront of issue prioritization and resolution because of its overwhelming impact on customer retention.

Why You Aren’t Doing Quality of Experience Today
While traditional Observability and Application Performance Monitoring (APM) tools have transformed how engineering and operations teams functioned over the past decade by monitoring Quality of Service (QoS), ECO is a paradigm shift in methodology where Quality of Experience (QoE) is at the core of operations, and will enable companies to be more efficient, more connected to their customers, and more cost-effective.
Consider the fact that businesses pour millions of dollars into their IT operations departments every year because they have been told that to prioritize the front-end user, they need to monitor the Four Golden Signals: Latency, Traffic, Errors, and Saturation. If you look through Google’s SRE Book for Monitoring Distributed Systems, you will see very concise definitions explaining what these metrics give you.
The 4 Golden Signals (performance metrics) of a traditional Quality-of-Service (QoS) Monitoring solution
- Latency: The time it takes to service a request.
- Traffic: A measure of how much demand is being placed on your system measured in a high-level system-specific metric.
- Errors: The rate of requests that fail, either explicitly (e.g., HTTP 500s), implicitly (for example, an HTTP 200 success response, but coupled with the wrong content), or by policy (for example, “If you committed to one-second response times, any request over one second is an error”).
- Saturation: How “full” your service is. A measure of your system fraction, emphasizing the resources that are most constrained (e.g., in a memory-constrained system, show memory; in an I/O-constrained system, show I/O).
These performance metrics, while important, don’t tell you what it’s like to use your digital product or service. Are users happy or unhappy that it’s taking 30 seconds for the video to start after they press Play?Performance metrics are a proxy measure at best for quality of experience, and every VP of Ops and CTO will still wake up to the firestorm that comes from angry customers complaining (often loudly) on social media that their app doesn’t work because managing Quality of Experience through traditional QoS tooling is no simple task. The complexity of monitoring and measuring every event, across every back-end system and front-end device, is staggering. Not only do you need to account for changes in things like server availability, location, memory utilization, device type, OS version, ISP congestion, and countless other dimensions, correlating how these dimensions interact with one another AND with end users’ actions at a global scale requires calculating trillions of datapoints every second. A QoS monitoring tool will break trying to do this in real-time.
Moreover, the Four Golden Signals can never answer the question, “Why is it taking my customers more than two minutes to sign up to my service?” This question, and others like it, is about Quality of Experience and not system performance (QoS). The infographic below is of a video streaming app but holds true for any digital service.
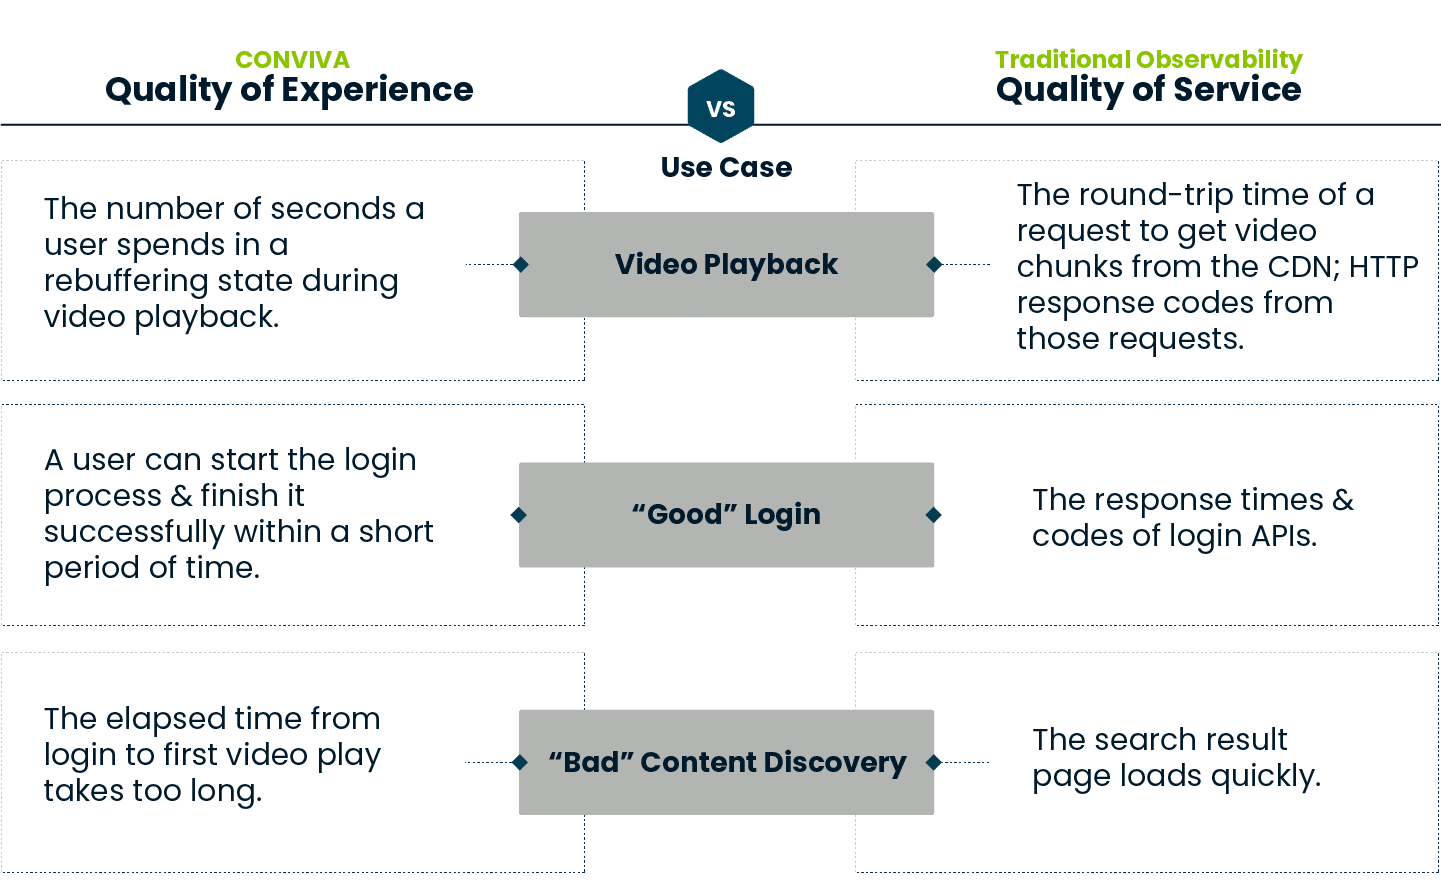
Quality of Experience (QoE) vs Quality of Service (QoS)
Although the Golden Signals might tell you your sign-up page has crashed, your SRE teams would need to boil the ocean to understand why your sign-up conversion rate drops by 18% over a 30-minute period. Conviva’s ECO service has been engineered from the ground up to answer Quality of Experience questions, so businesses can respond to QoE issues in real-time by connecting engagement (revenue generation) with issues on the backend.
The Moments that Matter
Conviva’s new ECO service measures customer experience and natively connects engagement to backend performance across the entire user journey, from application launch to video playback, and everything between. Out of the box Conviva can optimize the 4 most important touchpoints customers have with your business. These are the moments that truly matter for Media & Entertainment companies and Service Providers because they map directly to revenue generation. Conviva’s Experience-Centric approach to operations goes far beyond these four touchpoints and holistically monitors and prioritizes any issue that impacts experience with full visibility into the root-cause.

The 4 Moments that Matter (experience metrics) of Conviva’s Experience-Centric Operations service
Aditya Ganjam, Conviva Co-Founder and Chief Product Officer recently published a blog post making the case for Experience-Centric Operations. We can reference some of it here to explore how Conviva’s ECO solution can optimize users logging into your application.
In the picture below, we are looking at the Conviva UI for a live sports app, specifically tracking an experience metric called Login Processing Time in the lead up to a big event. This metric measures the time taken to complete the login process after the user has entered their credentials and clicked login. It would include any SSO integration, third party authentication checks, and other activities to complete the login process and bring up a working application. It’s important to note that this is not as simple as measuring the response of a single API call.

While monitoring the metric, we see a sudden spike just before the event is about to start. Because we are directly measuring Login Processing Time, we immediately know that users are impacted and how many are impacted. With just two clicks, in the picture next page, we determine that only users on a specific iPhone 15 version and on two specific device models are experiencing the login problem.

With two more clicks, in the picture below, we pinpoint a slow call to a third-party authentication service. In this case, no amount of meticulous backend monitoring would have helped us locate root-cause, as it is a third-party issue. With user-centric operational monitoring, however, we easily connected the dots from Login Processing Time to the specific device models to the specific network call, leaving us with a clear understanding of the issue and its impact, and a concrete action to resolve the issue.

ECO Core Capabilities
Census-Level Data Ingestion: Get real-time and comprehensive ingestion without data sampling from multiple clients via an extremely lightweight SDK.
Advanced Event Contextualization: Convert raw events from an ecosystem of devices and platforms so they all mean the same thing, regardless of how they were labeled by the original development team using our no-code UI. Apples now mean apples across iOS, Android, and more! Conviva lets you translate these data into useful contextual sessions for analysis such as “successful purchase” or “searched for content.”
No-Code Server-Side Metric Creation: Easily create metrics important for your company using our UI, such as the time it takes users to subscribe, the number of users able to log-in under 2 minutes, and more through our server-side metric builder. Conviva’s metric builder empowers operations teams by giving them the agency to track user experiences they think are important to the business without ever needing to update the SDK or chase software teams to prioritize new development.
Operational Efficiency Through Artificial Intelligence Alerting and Root-Cause Analysis: Save your business more than 30,000 labor hours with AI-driven alerts that surface anomalous events and point out issues you may not even know you should be looking for.
Clicks, Not Queries on Real-Time Data: The Conviva UI enables operators to click on any dimension such as device type, CDN, OS version, ISP, region, or network request, and to drill down into an issue without needing to write a single line of code or query. Out of the box Conviva provides 50+ dimensions for analysis, with our largest customers leveraging more than 100 unique dimensions.
Issue Prioritization Based on Cumulative Quality of Experience (QoE) Impact: Elevate and resolve issues impacting a customer’s ability to use your product or service.
“With Conviva, we can deliver our KPIs because everything is set up out of the box, from customer experience metrics to the ability to instantly correlate unexpected changes in engagement to performance issues on the backend. Not only was the SDK easy to integrate, but we have also been able to consolidate our technology spend by deploying Conviva for multiple use cases, including application analytics and video delivery. Conviva lets us know exactly what our customers are experiencing and that is a game changer.”
Sander Kouwenhove
Chief Technology Officer, NLZIET
If you are already a Conviva customer, please reach out to your account team to get started with Conviva’s new Experience-Centric Operations service. If you are not an existing Conviva customer, please request a demo and we will get in touch.
Learn more about Conviva and explore how we partnered with Peacock to deliver the largest Live Event video stream in US history by reading the recent blog article here.