


Success or failure for today’s digital businesses often hinges on their web and mobile apps. Regardless of the market or industry, engineering, IT, and product teams must deliver an available, functional, and delightful experience for their users. For these technical teams, the juggling act is meeting large numbers of users across software that’s increasingly reliant on complex distributed systems, cloud infrastructure, and an explosion of web and mobile dependencies (including third parties).Therefore, it’s no surprise that companies allocate large budgets for observability solutions promising to monitor, troubleshoot, and optimize customer experience; all while aligning to revenue goals.
So what is observability, really?
Traditional observability helps companies collect, monitor, and interpret software performance. IT Ops and engineering teams use these to alert on performance problems and abnormalities, hopefully catching them before they impact customer experience. To help visualize and monitor infrastructure, application, and end user experience, Observability tools typically ingest MELT telemetry data: metrics, events, logs, and traces.
Metrics provide an overview of performance across core system components. RED metrics, or “rate,” “error,” and “duration,” are often known as “golden signals” for the health of infrastructure and application performance. CPU usage, memory, and throughput are common measurements that metrics bring to life. For example, “CPU usage,” measures the percentage of the central processing unit’s capacity that is being used by the computer’s operating system and all running processes. IT professionals can monitor and manage the performance of computer systems, helping to identify when a system is overburdened or underutilized, and to make decisions about resource allocation, system optimization, and when to scale up or scale down infrastructure.
Trace data is a detailed chronological record of the execution paths taken through software code, capturing function calls, executed statements, and interactions within a system. It is becoming more popular within technical teams who need to understand the behavior of applications, particularly in complex microservice architectures or distributed systems. Teams can trace an entire transaction from web and mobile, through backend services, and into the database. This helps pinpoint bottlenecks for performance that spans several hops from services and their dependencies.
The most granular data are logs and events: point-in-time measurements or information triggered from a system request or response (typically executed by the end user) which can span the client side to backend services. For example, end users clicking “enter” at log in (after entering their credentials of course), may trigger events that record the following information:
- User credentials submission: timestamp, username, IP address, device and browser
- Authentication process: authentication method, success/failure, session ID
- Session initialization: session ID, user ID, timestamp, device and browser
- User activity events: pageview, fileAccess, dataquery, actions by user, resources accessed, timestamps
- Errors and exceptions: error codes, stack traces, affected system components
This level of granularity is helpful to find the precise, likely cause of an issue.
While MELT data can be helpful to find the cause of an issue, it is critical that Observability solutions provide intuitive user interfaces that provide quick system context to teams who troubleshoot. While this is the ideal, it is far from the norm.
Traditional observability solutions can miss detailed customer experience.
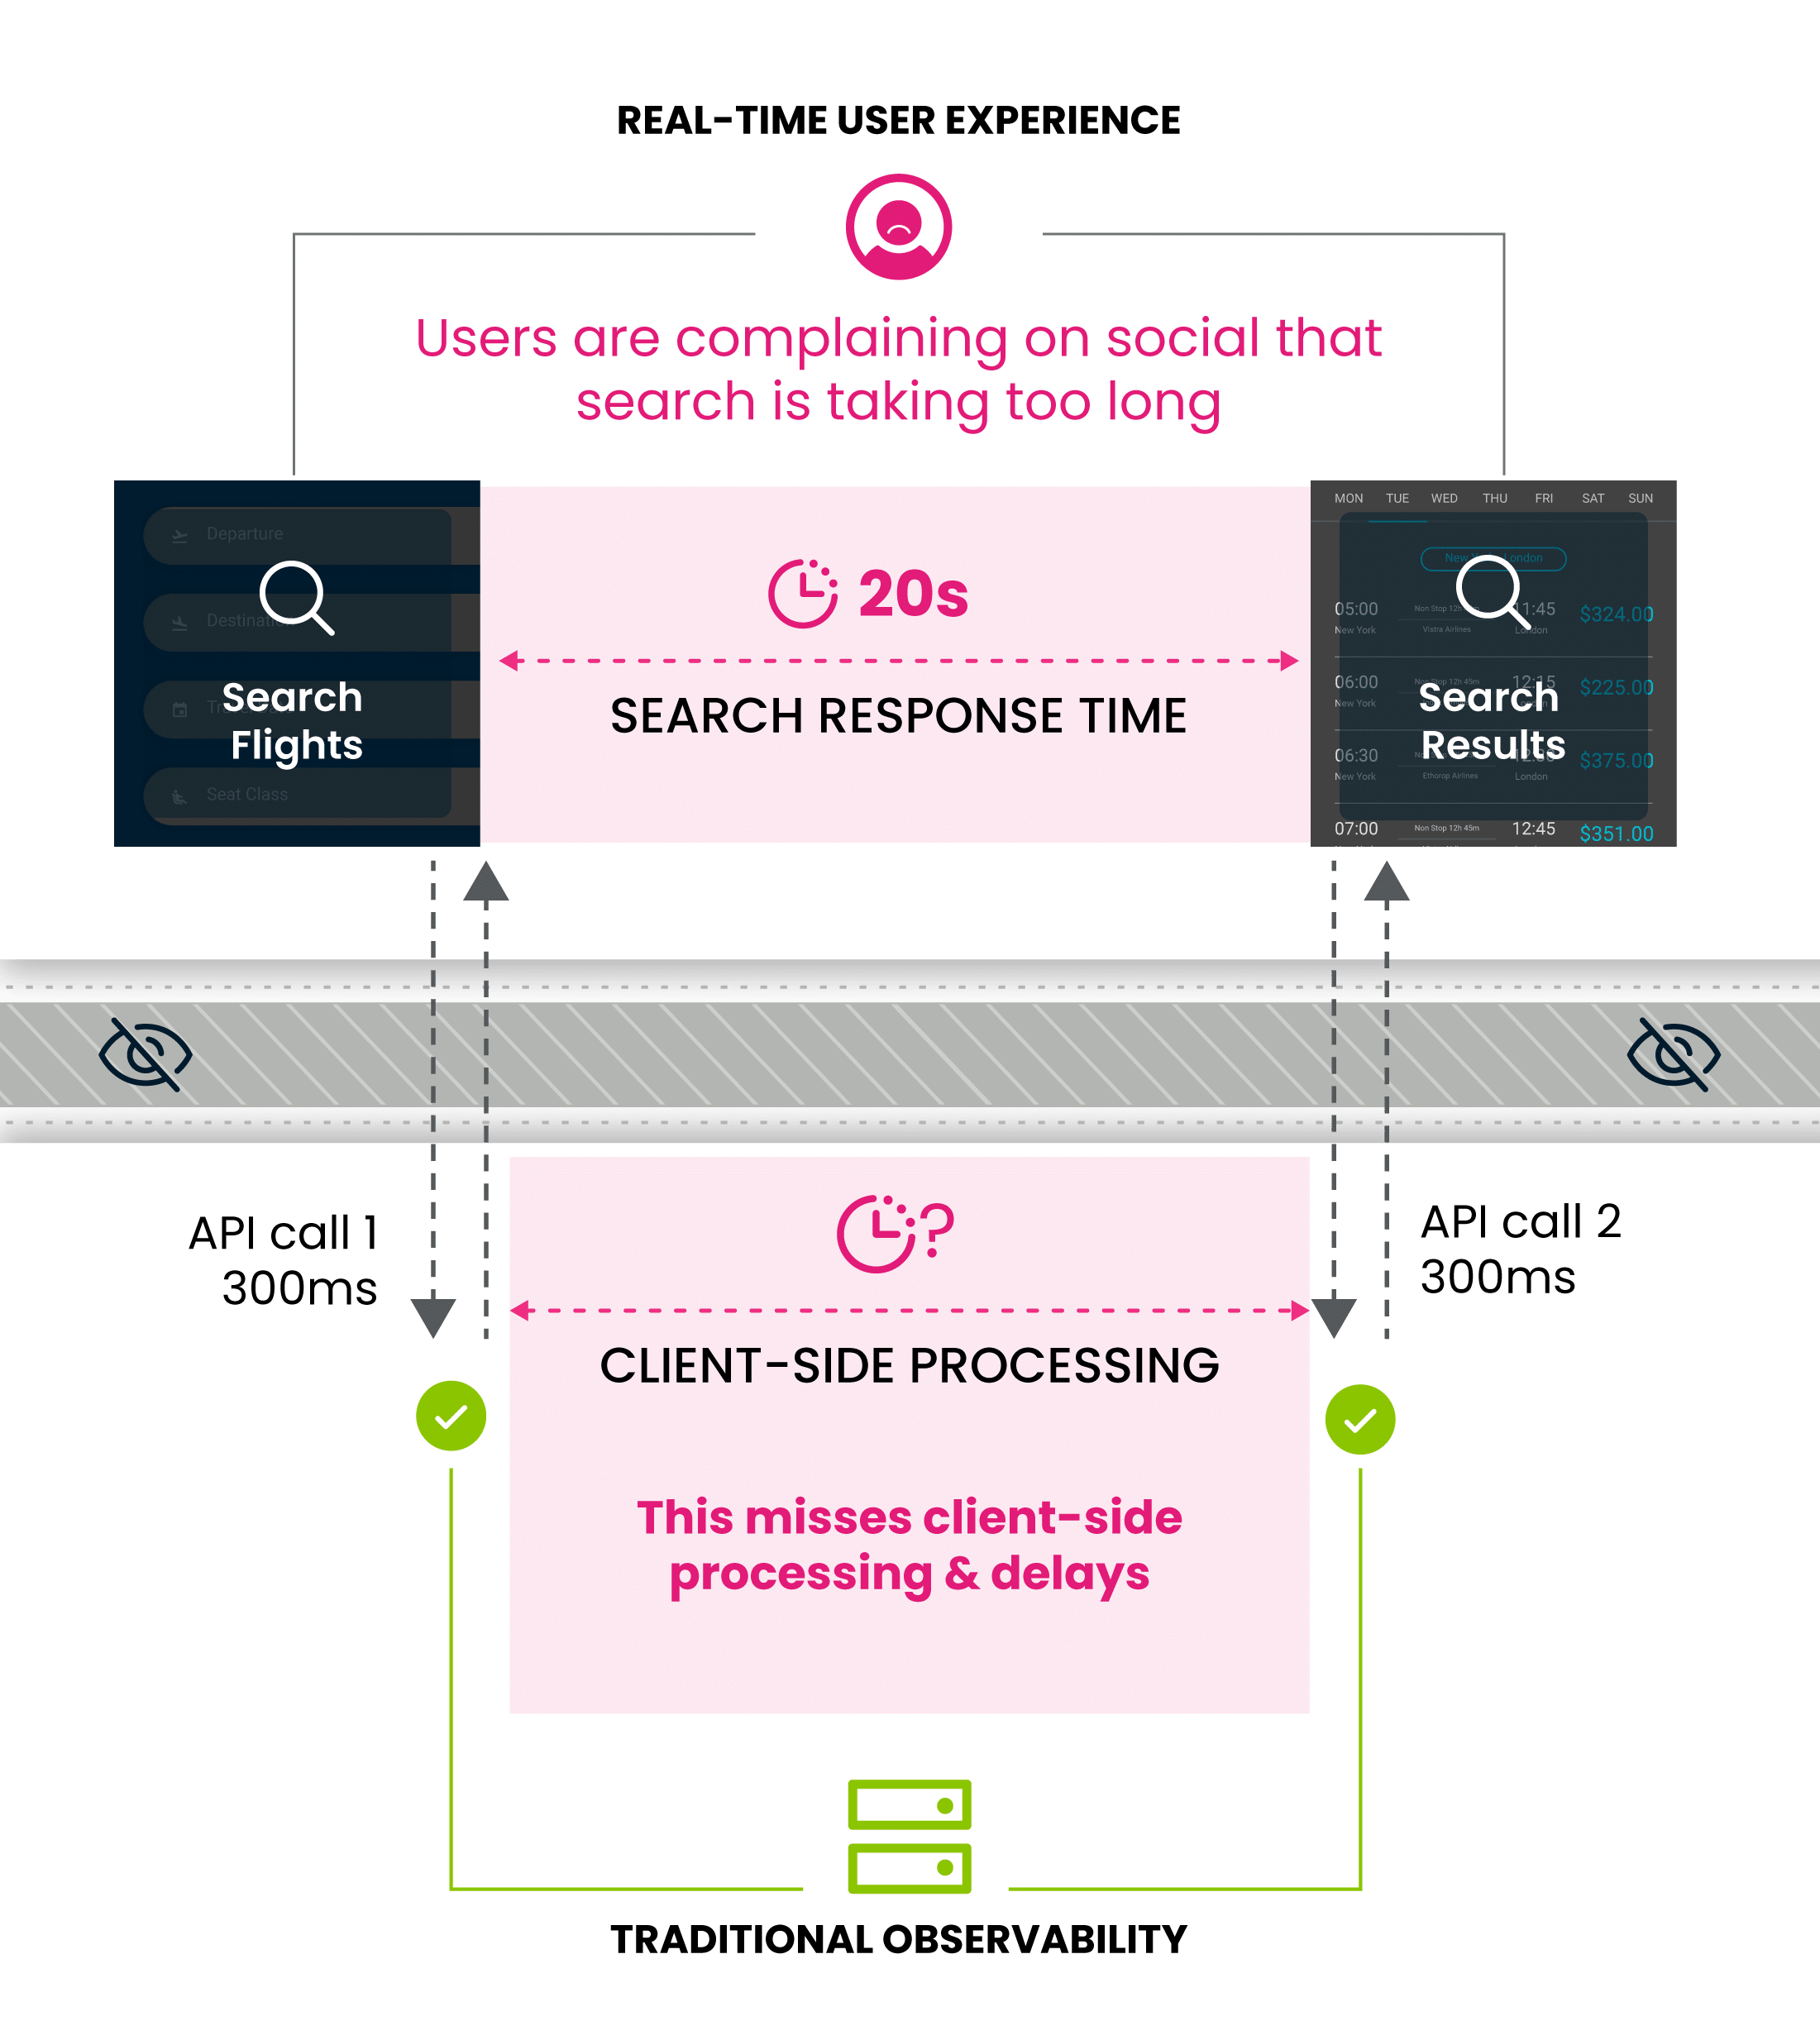
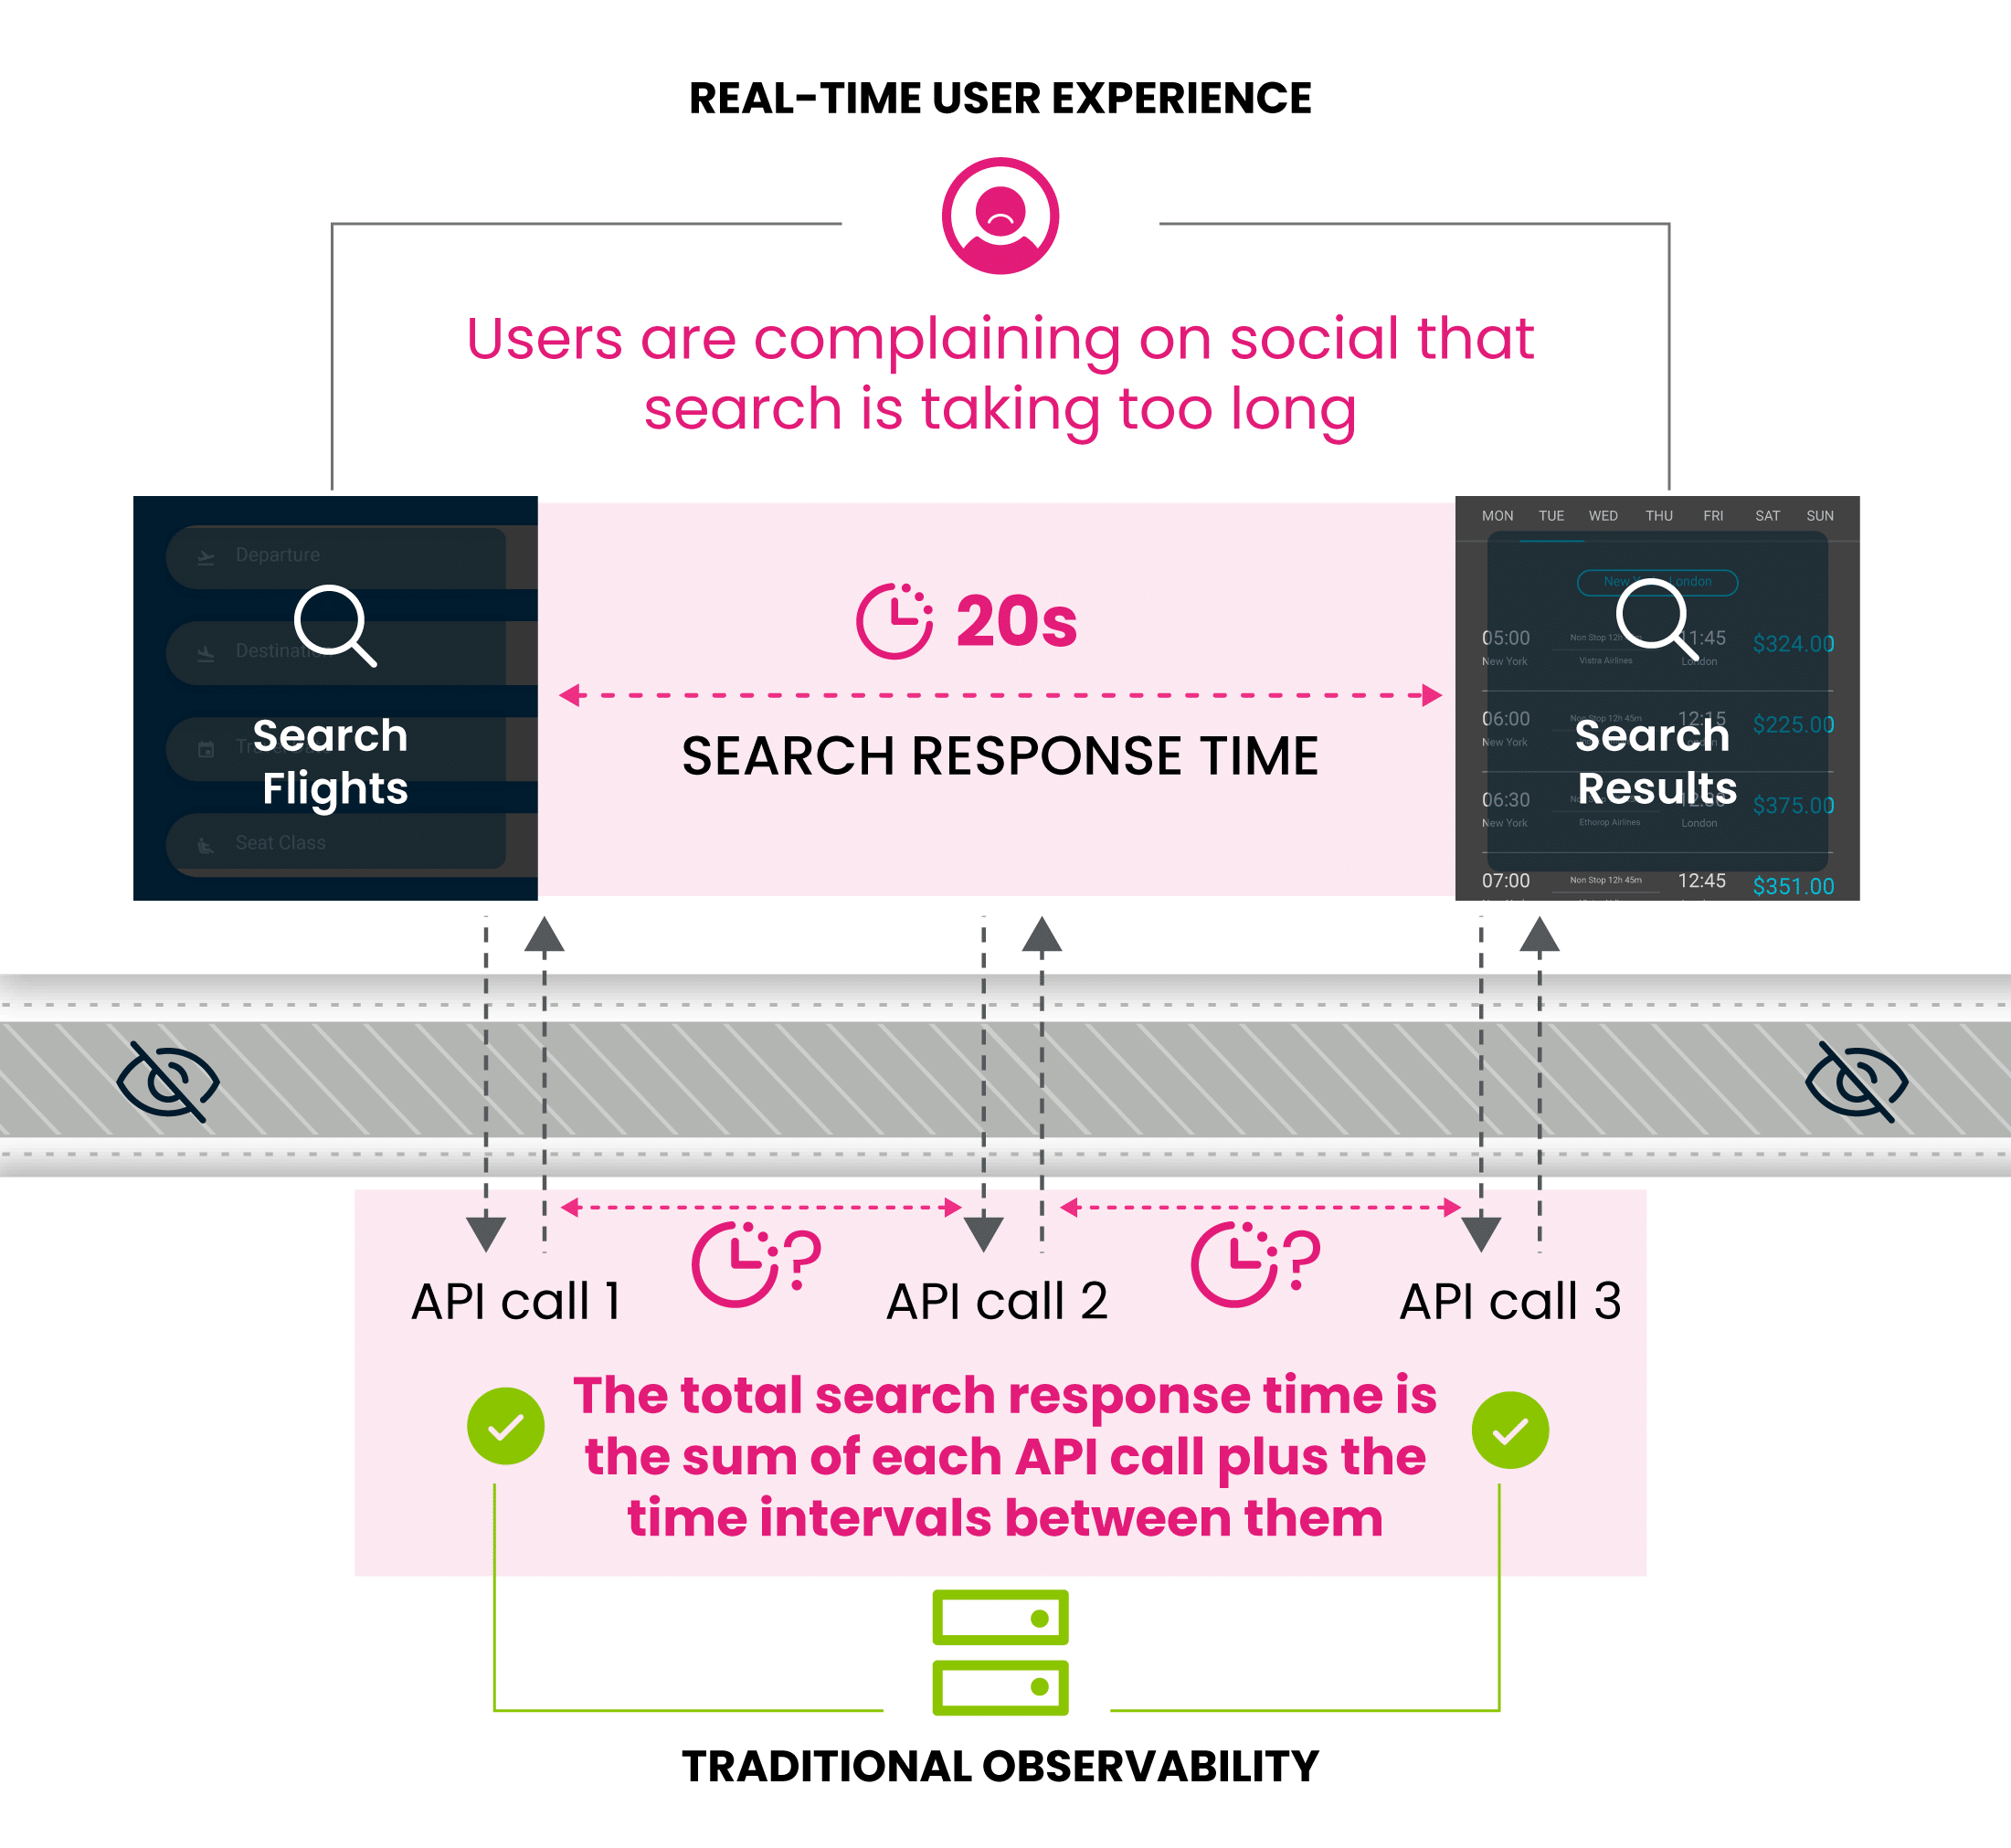
While these tools help technical teams benchmark and improve app performance they are less useful for improving end user experience. Modern digital businesses delivering experiences across cloud native environments often guess at which improvements will drive the biggest engagement across web and mobile. Real User Monitoring and Synthetic Monitoring provide page level metrics and aggregate overall performance into percentiles. For example, a web page delivers their largest image (Largest Contentful Paint) to its end users in 2.5 seconds for 90% of customers. While metrics like these are helpful to inform an end user’s experience, they are not enough to help teams determine where to improve, or how the page’s total experience drives their business funnel. For troubleshooting, engineers spending time on call have little information from these metrics that help scope an issue. For cost, ingesting all user metrics can be costly.
Here’s a brief summary of user experience limitations for existing Observability:
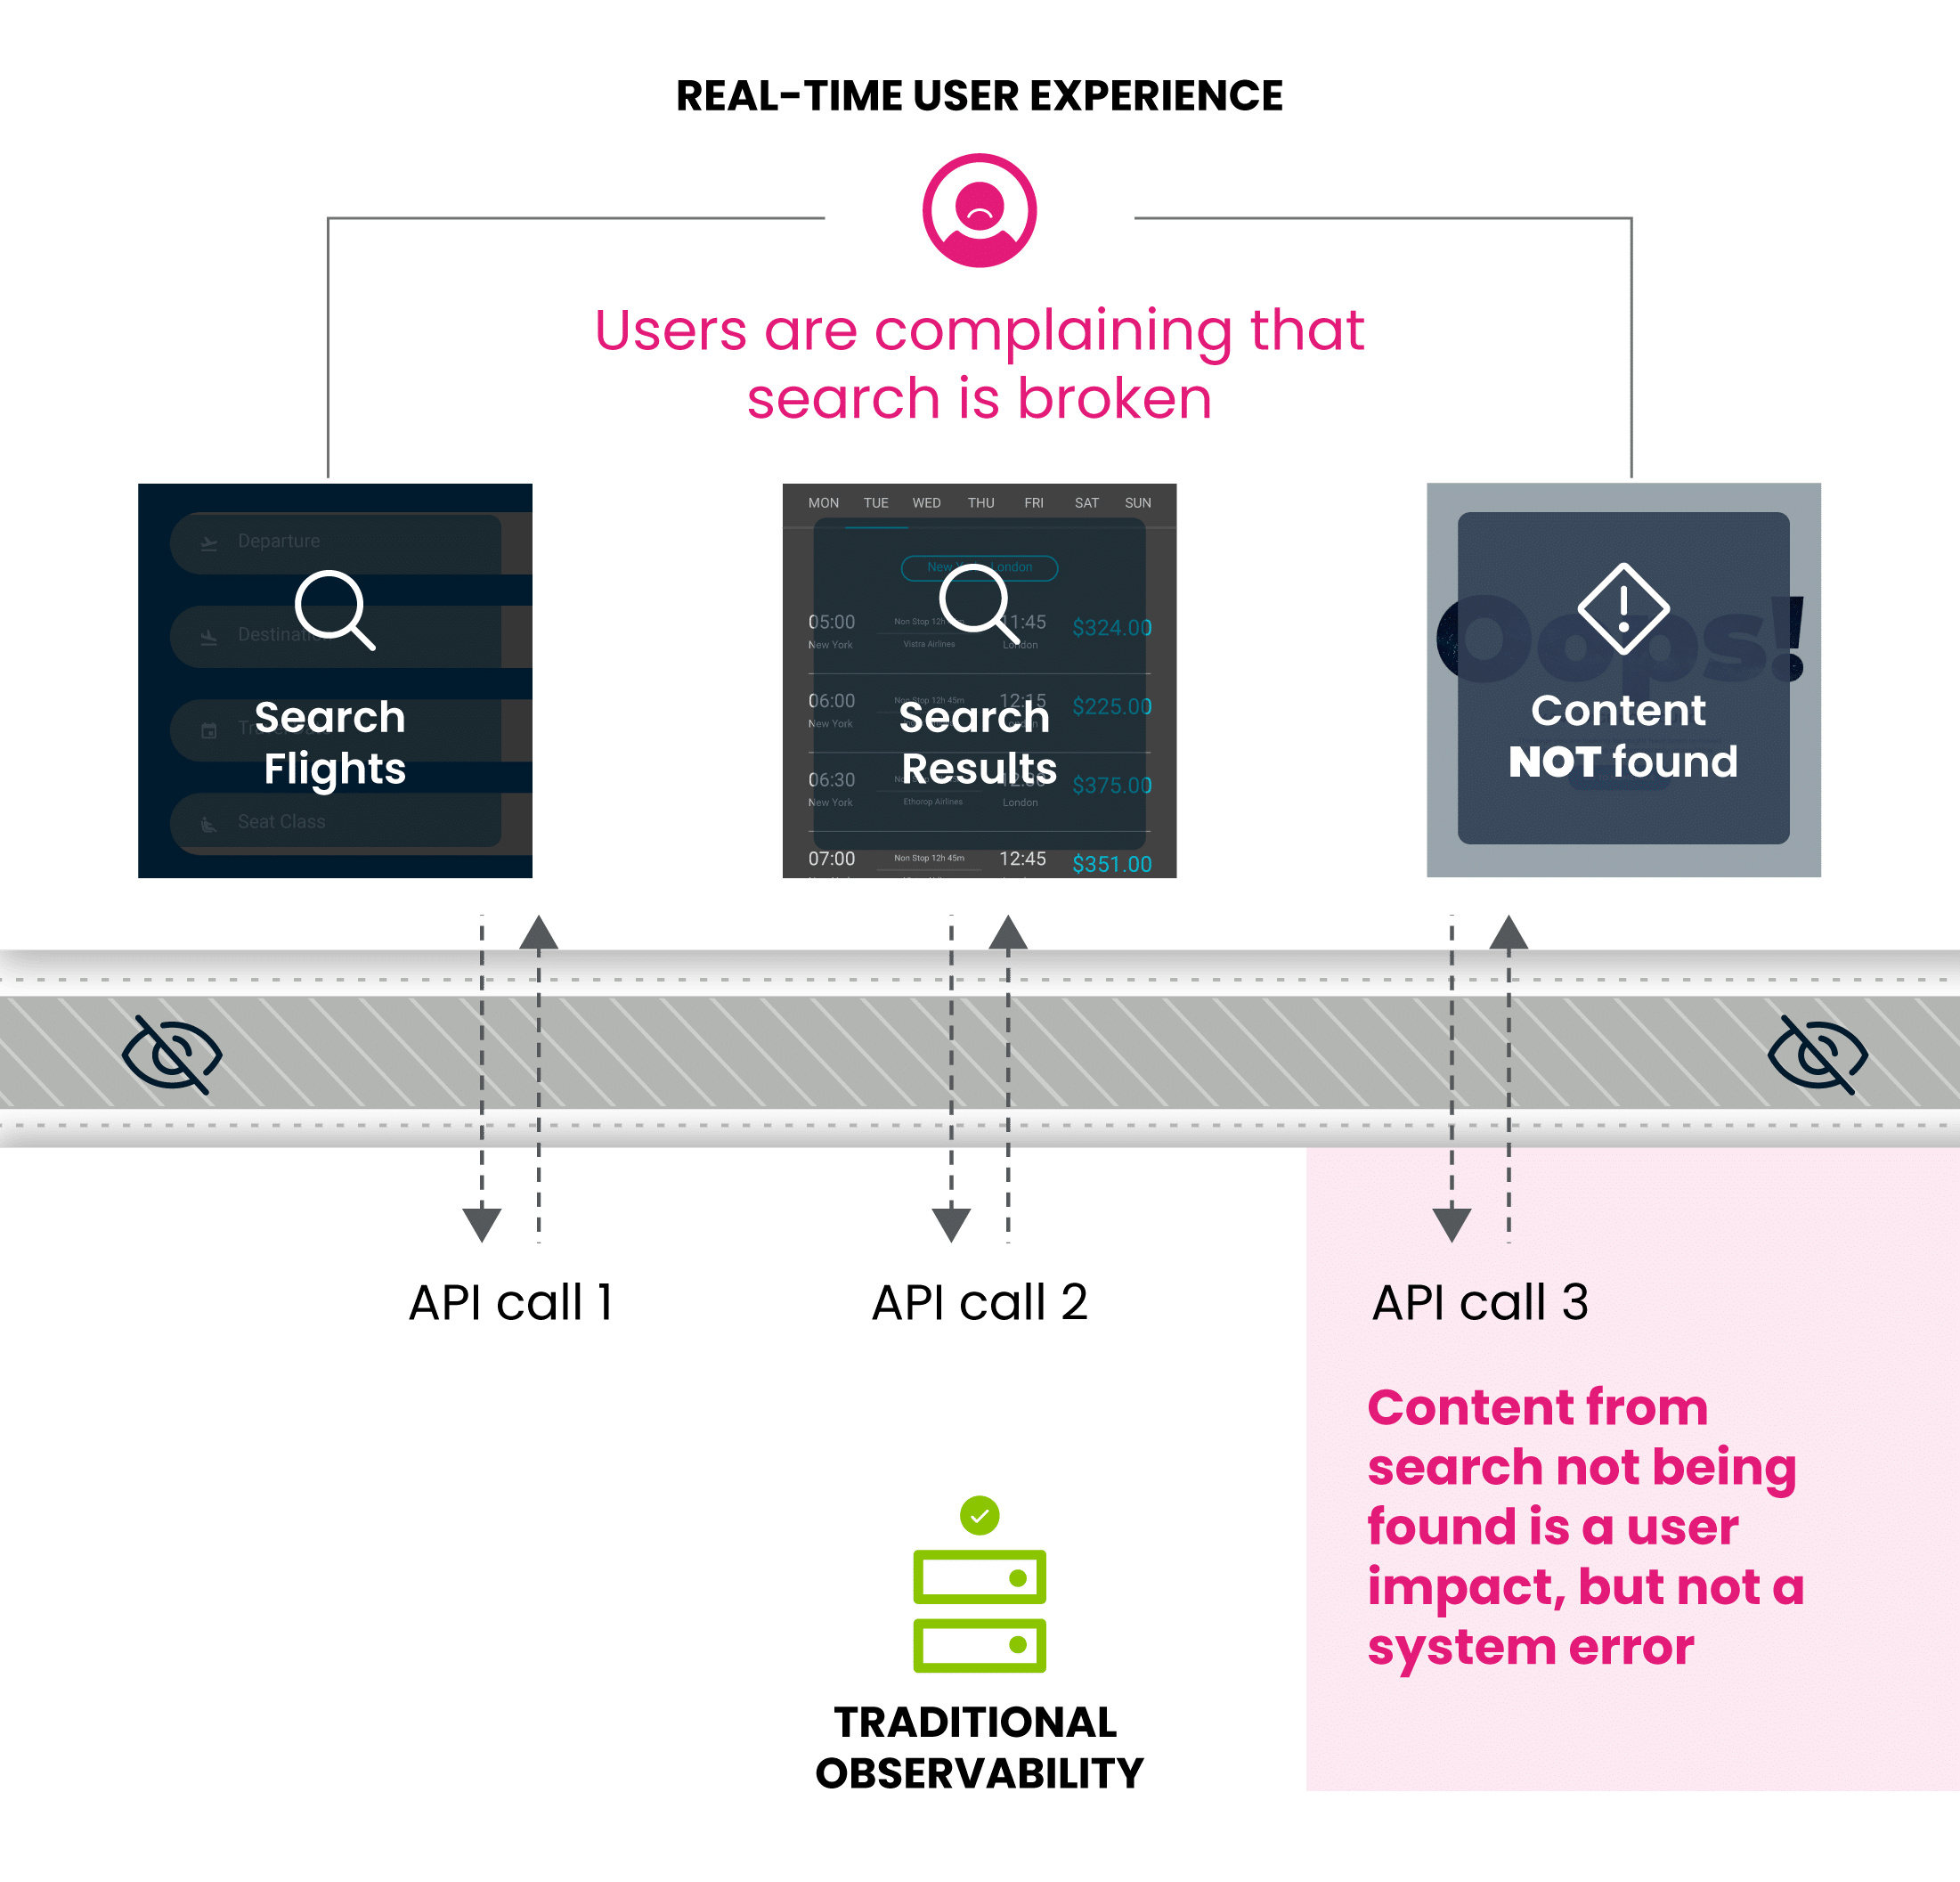
1. Lack of User-Centric Insights
With limited understanding of user behavior and preferences and how they relate to app performance, ops teams have difficulty addressing issues that impact individual users. It’s also risky to rely on app performance metrics as a proxy for user experience. A slow API or a server going down on the edge may or may not actually impact your user. Without insight into the user experience, correctly correlated to app performance, teams cannot readily see which issues to prioritize and may waste time and resources on solutions that only help a fraction of a percent of users (or worse, no one at all), while larger problems go unaddressed. It’s not uncommon to spend money fixing the wrong problem.
2. Slow Issue Resolution
With no clear path through the data to root causes, teams face challenges in proactively identifying and resolving user experience issues. Issue detection is often delayed, meaning increased downtime and disruptions. After fixes are implemented, they often don’t know for sure if the real issue is resolved as there is no direct validation of user experience.
3. Limited Technology
Real-User Monitoring (RUM) Observability tools are often a ‘free’ entry point for observability vendors hoping to sell costlier solutions such as infrastructure monitoring. While the client side agent may be free, running the computations on the backend will add cost over time. Additionally many of the tools are only powerful enough to monitor a small portion of users, meaning they leave ops teams still unable to solve specific issues, even while using up their budget.
Because achieving true end-to-end visibility on the user journey is so difficult and costly, many digital businesses just end up hoping that the quality of their content or product or service is so exemplary that it outweighs any negative experiences that their users might be encountering in their app. Or, if they’re truly committed to happy customers, they’re sinking huge numbers of dollars into expensive tech stacks that allow them to at least get some sense of what’s going on for their users and how that relates to technical performance metrics on the back-end.
Content is king, but Quality of Experience (QoE) reigns supreme.
When users are polled on app usage, 50% of them report they are committed to a particular app, not because they love the content or the products or the service, but because they enjoy the Quality of Experience when using the app. So yes, it is important for companies to be offering stellar content, services, and products, but it is equally important for them to be guaranteeing a flawless experience in the app.
After more than a decade in video streaming, Conviva has been able to breakdown the user journey into four milestones, three of which are critical for user engagement and retention across all applications, with the remaining one (video playback) being unique to media and entertainment:
- Sign Up: 52% of users won’t continue on an app if it takes more than 2 minutes to sign up.
- Login: 86.8% of users who fail to login will not return to an app for 7 days.
- Discovery: 23% of users disengage if they can’t find something of interest to them in under 11 minutes.
- Playback: Viewers spend 63% less time watching videos if they encounter a poor streaming experience, which includes high buffering rates, etc.

As shown, user wait times in any of the four critical user flows have a material impact on your business. If your observability tool is not able to give your ops team detailed insight into what users are experiencing and why an experience may not be meeting their expectations as they interact with your service, from sign-up to login to discovery to playback, you are likely wasting budget on systems that don’t actually monitor what matters most for your business. What you really need is a solution that delivers real-time performance analytics, or scalable experience monitoring and analytics with ultra-low latency, so that you’re no longer scrambling to figure out what’s going on when user experience complaints start flooding in over social media, even though all your performance metrics look great.
Why is your app sign-up taking over 7 minutes and what can you do about it?
Conviva’s Operational Data Platform focuses on the biggest problem to digital businesses today: Quality of Experience. For product, engineering, and operations teams building and operating complex web and mobile apps, Conviva is the only solution to reveal how web and mobile apps meet their user expectations, or quality of experience.
We achieve this by ingesting all user data, activating only the data you need, and adding custom metrics to represent true user experience with business-relevant context; no blind spots, super cost effective, aligned to business workflows. Next, AI is applied to reduce noisy alerts and help teams instantly focus on the biggest customer-impacting problems. When issues happen, teams zoom from high level investigation to granular root cause in a few clicks.
Because Conviva correlates and trends all user experience data, teams can confidently prioritize web and app improvements that drive customer engagement across key user flows. Our super-efficient data processing engine and one-click customization means organizations spend less money on monitoring, with less engineering toil.
The result? IT, engineering, and product teams focus on measurements that matter most to their role, service, and line of business, right from the beginning. When problems happen, teams start with the biggest customer issues then dig to root cause across their systems in a few clicks.
The paradigm shift here is teams and business units focusing on the most important measurements, right from the start.
So how exactly does real-time performance analytics work?
Conviva’s platform comes pre-loaded with standard experience metrics to help you get started with user-centric operations, but your ops teams can also easily create custom business events and associated metrics that track the exact moments and measurements from the user journey which are most important for your business. After a simple set-up, our sensor in your app begins capturing all user data, but our AI-guided monitoring and analysis allows you to filter out noise and focus only on mapping relevant data to your custom events and metrics, allowing for near instantaneous experience issue detection.
Each issue is accompanied by stateful diagnostics, with multi-dimensional drill-down across all client signals, allowing you to quickly and accurately pinpoint root cause in client-side performance, backend performance, or 3rd-party performance. What’s even better is that Conviva’s platform requires no code and no queries to surface all this information, meaning ops teams can dramatically reduce MTTI and MTTR thanks to the ability to share immediately actionable insights with other teams across their business for quick resolution.
Ops teams working with Conviva no longer need to spend weeks combing through logs, calling in other teams to provide support, creating complex queries, or discovering nasty surprises about user experience from social media. Instead, they’ll have immediate information and solutions for business-critical issues like the 7-minute sign-up, the skyrocketing bounce rate, the sudden drop in viewer minutes, and beyond. Here’s what Sander Kouwenhoven, CTO of NLZiet had to say about working with Conviva:
“With Conviva, we can deliver our KPIs because everything is set up out of the box, from customer experience metrics to the ability to instantly correlate unexpected changes in engagement to performance issues on the backend…We have also been able to consolidate our technology spend by deploying Conviva for multiple use cases, including application analytics and video delivery. Conviva lets us know exactly what our customers are experiencing and that is a game changer.”
Unlock the full potential of real-time performance analytics with Conviva.
Your teams deserve better than a suite of outdated observability tools that may help them surface any number of performance problems, but without any understanding of what users are actually experiencing. The user experience on your app is the foundation of your digital business; it’s time to optimize it intelligently, so you can prioritize engagement, retention, and growth. With Conviva’s approach to real-time performance analytics, you’ll be able to truly elevate your user’s experience – not just across the board, but all the way down to the level of the individual user who has called into your customer support team for help.