One of the primary benefits of Real User Monitoring (RUM) solutions is their ability to provide valuable insights into how real users interact with websites and applications. The fundamental promise of RUM is rooted in understanding user behavior so that we can optimize our digital properties, ensuring a seamless and engaging experience that leads to higher user satisfaction and retention.
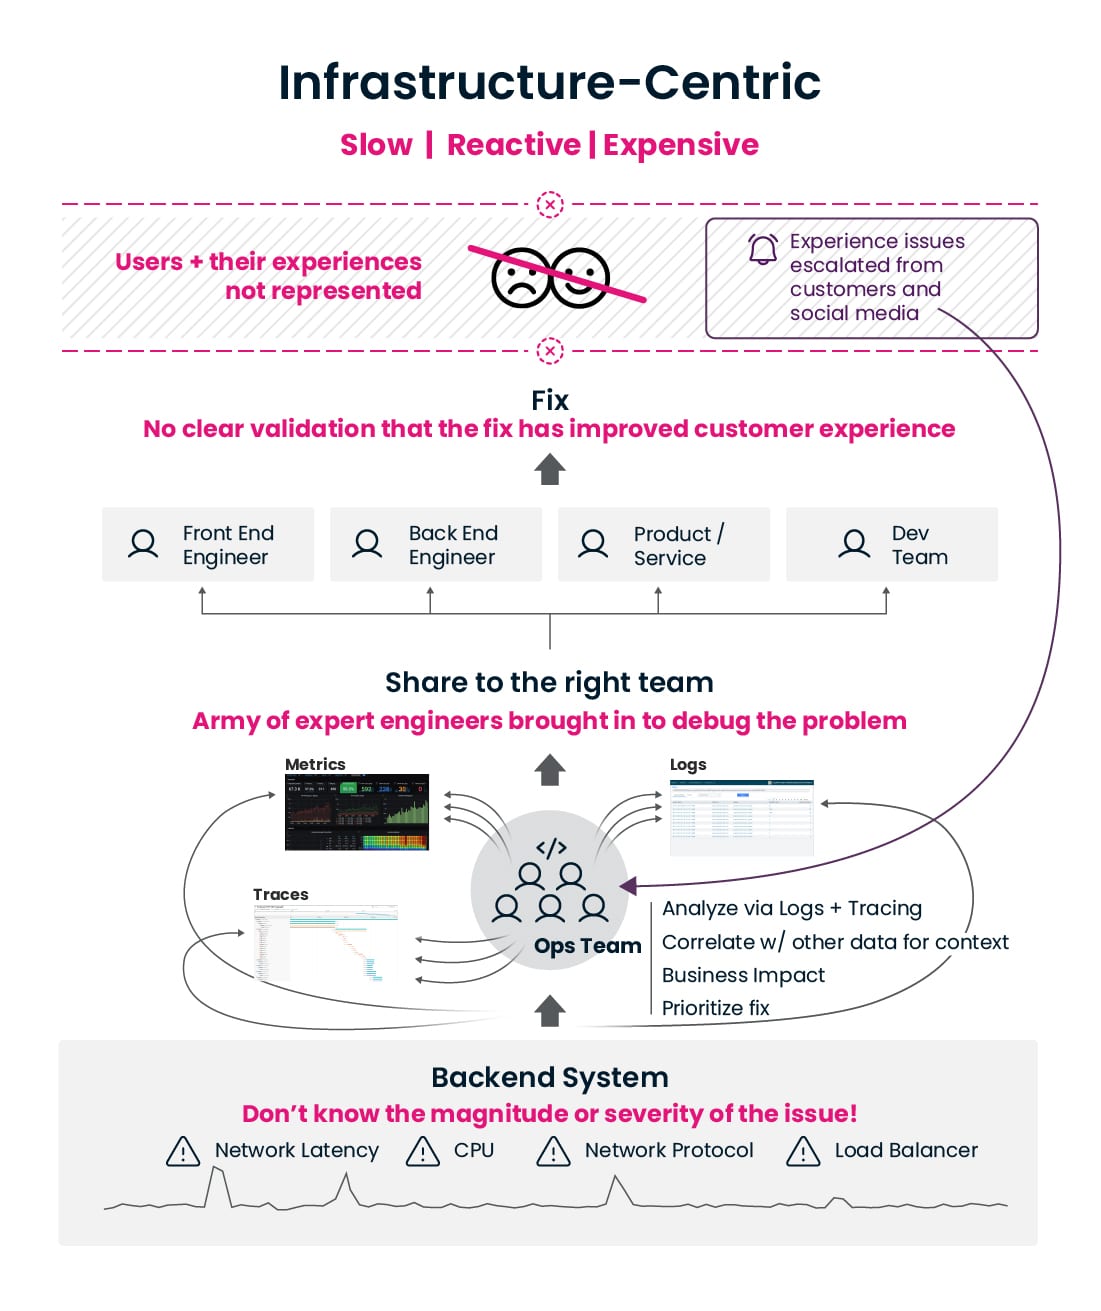
However, in our ongoing adoption of RUM and other observability solutions, we seem to have lost sight of something critical – the users themselves and their experience.
Sure, RUM tools give us all sorts of metrics – page load times, error counts, crashes, and network requests. But these metrics aren’t about users. They mostly tell us how our back-end systems are performing. They don’t inherently provide us with insights into how to create a delightful experience that keeps users engaged.

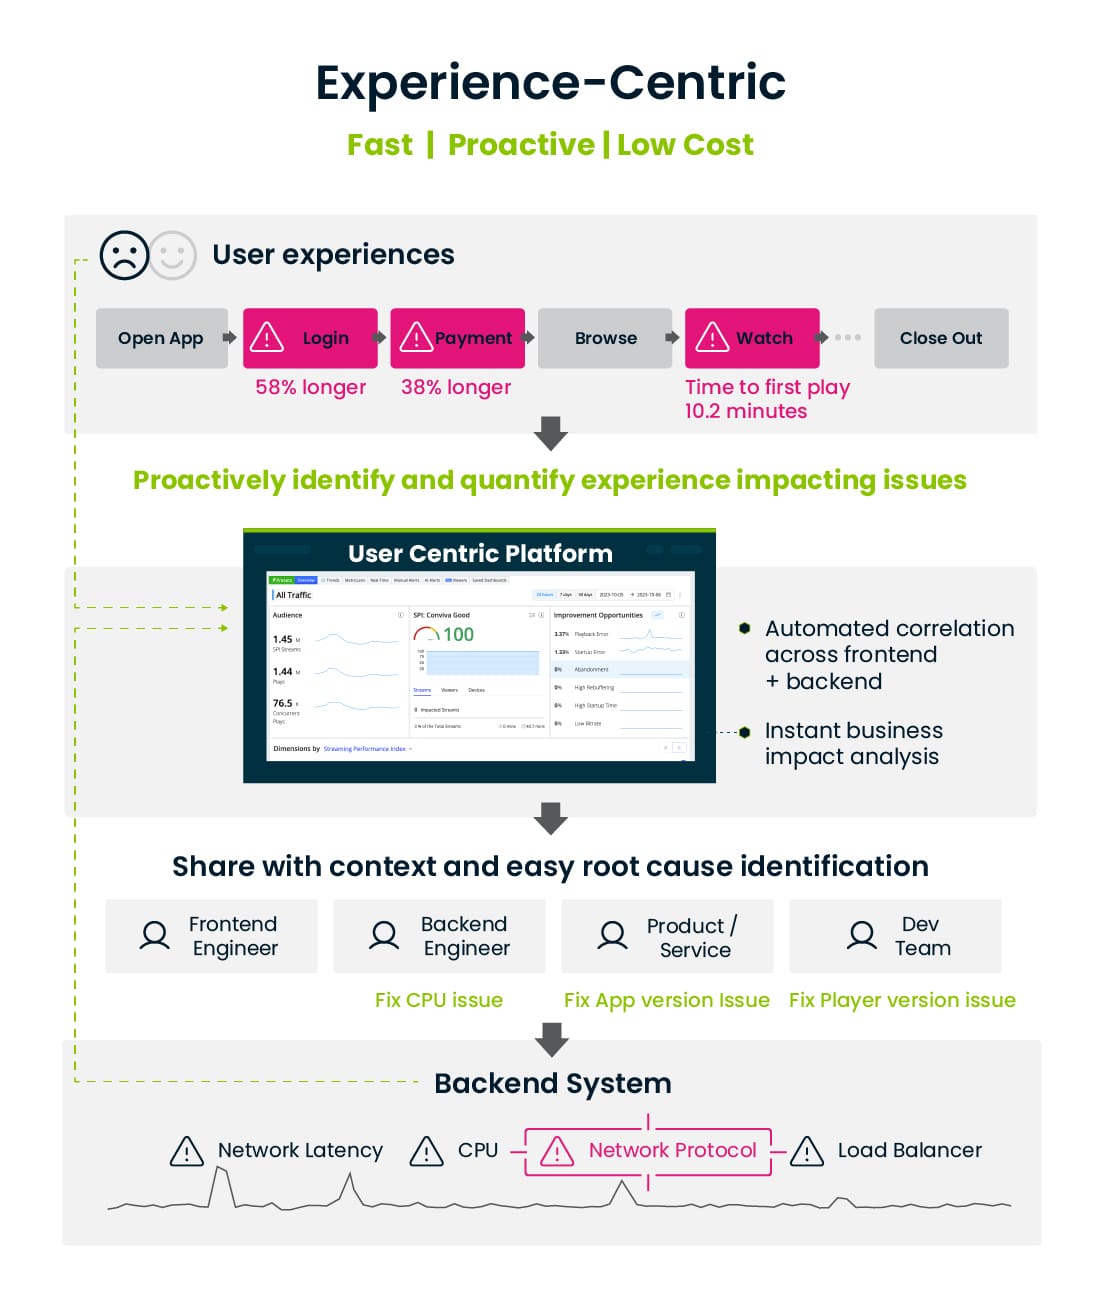
Let’s take a simple example – a sluggish network request. From a pure performance perspective, it may not seem like a big deal. But if it’s significantly delaying the login process, it’s a major user experience problem that results in lower streaming minutes, lower ad impressions and revenue, and lower engagement. The world’s largest streamers make over $30M per day in ad revenue and much more. You need the ability to uncover correlations and compute customized, app-specific metrics that truly reflect the user experience to protect revenue leakage.
So, it’s time we shift our focus back to what users are going through in real-time. And at Conviva, we believe that’s more than an alert about app error numbers or network latency on sampled data.
Understanding user experience means being able to answer questions like:
-
- Why does it take so long for users to subscribe?
- What percentage of users can successfully log in on their first attempt?
- What’s the subscription drop-off percentage, correlated with a specific error?
- Which app errors are impacting user experience vs. non-critical errors?
- What’s my App’s bounce rate and why?
And doing it in real-time means you can answer all those questions in less than a minute, for every user and every session – without having to write multiple queries or send data to a separate analytics system and team for further analysis and reporting.
Why? Because by understanding and enhancing that real-time user experience, we can boost customer satisfaction, engagement, and revenue. When $30M per day of advertising revenue is on the line, you can’t afford to wait days or even hours to identify and fix problems.
It’s within the real-time customer experience that companies can optimize what Conviva calls the “Moments that Matter.” These moments include metrics like streaming minutes watched, time to purchase, and subscription upgrades. More streaming minutes translate into more ad impressions, leading to increased ad revenue. Homepage personalization might entice users to add items to their cart more quickly, resulting in faster time to purchase. A faster login process results in a faster time to first play, while reduced credit card payment processing time leads to a higher number of subscription upgrades.
Is it interesting to know just the number of network request errors? Sure, it’s nice to have some additional insight into how your apps are working. But, what is actually useful is to know how long it’s taking subscribers to log in right now and that’s why we have a lower number of subscriber upgrades today.
If some of these network request errors contribute to longer login times, then they need to be correlated with the associated application errors and their effects on login duration. Otherwise, alerting on network request errors is extraneous noise.
To safeguard the “Moments that Matter,” such as time to first play, subscription upgrades, purchases completed, trips booked, and minutes watched, companies must move beyond traditional RUM solutions. They must optimize real-time issues that affect backend performance, user experience, and user engagement simultaneously:
-
- Performance: This is where RUM solutions primarily reside, encompassing client-side performance monitoring, including errors, crashes, page load times, and network request durations.
- Experience: This layer focuses on what users actually see and experience. What’s the experience like when they log in? How long does it take from scrolling through content to watching? These are the questions we need to answer, and they require the ability to compute metrics derived from a series of events and time intervals.
- Engagement: These insights are often handled by analytics tools like Adobe or MixPanel. This layer considers user engagement frequency, return rates, and the most frequently followed user paths. It’s a crucial component for understanding how backend performance and user experience drive user engagement, conversions, and sign-ups.
To derive actionable insights, companies must monitor, manage, and optimize across all three layers simultaneously and in real time. Each layer is interrelated and monitoring only one of these layers limits operational teams’ ability to make changes that directly impact business outcomes. Read more about the Time-State technology behind how we are able to create experience metrics across all three layers.

This holistic, experience-centric approach matters because the way users interact with your app directly influences your revenue. Performance affects experience, which, in turn, drives engagement. By seamlessly capturing data across all three layers, you empower your teams to connect the dots and achieve results that make a real impact on your bottom line.
Read about how a popular sports publisher streamlined their app log-in process to accelerate time to first play for loyal fans.


