Redefining Observability: The Experience-Centric Approach
Your business needs Experience-Centric Operations
While Observability and Application Performance Monitoring (APM) tools have transformed how engineering and operations teams function over the last ten years, there are several challenges that every VP of Ops and CTO still face with no clear solution in sight:
- Being surprised by customer issues on social media, from
customer support calls, or through the CEO, even when their tools
say everything is fine. - Needing an army of expert engineers to debug whenever a major
incident happens. - Exploding costs of observability tools to monitor their growing
infrastructure.
These challenges are all rooted in the same underlying problem. Existing
Observability tools and the teams that use them are disconnected from what really matters to the business: user experience and engagement.
Disconnect Between Operational Tools and Customer Experience
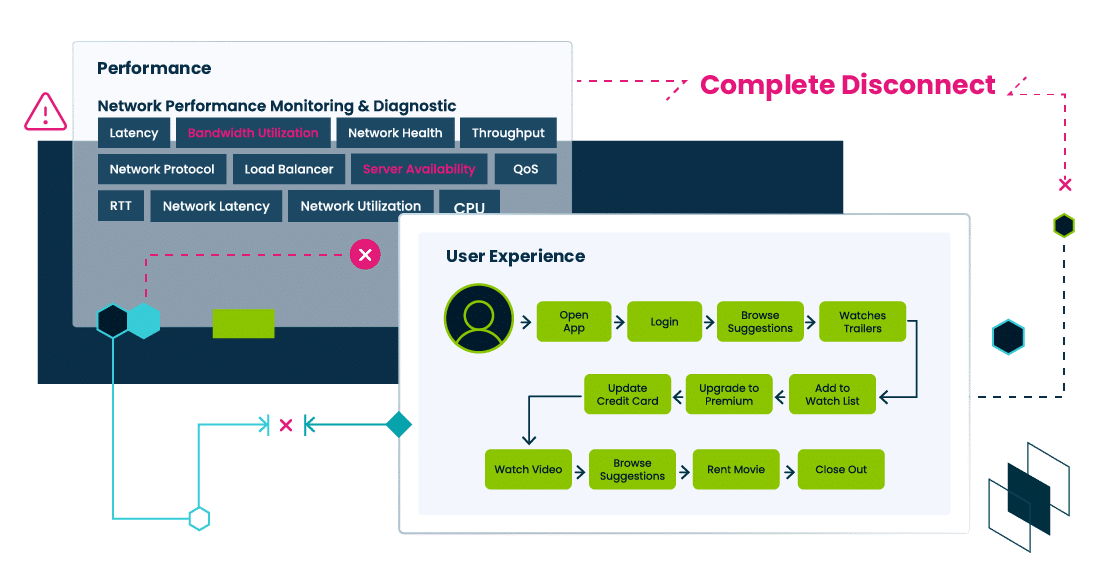
Operations need to evolve from focusing on low-level system performance to higher-level user experience. Experience-Centric Operations is a new paradigm that will transform operations and engineering teams to be more efficient, more connected to the business, and more cost effective.
What is Experience-Centric Operations?
Experience-Centric Operations is a shift in methodology where user experience is at the core of operations. System level monitoring is, of course, needed but is not always kept in context of user experience in real time. By user experience, we are not talking about page load times and crashes on a small sample of users. We are talking about monitoring every user flow across every user in the application in a quantified manner in real-time. If a user is not able to login, sign up, or find content within an expected period of time, we should be alerted to the issue. If the percentage of successful sign ups suddenly dropped from 98% to 94% for whatever reason, we should know about it immediately—and not because we read complaints on social media.
Experience-Centric Operations circumvents these problems by intrinsically connecting a comprehensive measurement of user experience with system and application performance, removing surprise escalations, democratizing diagnostics by natively connecting the dots, and reducing cost by focusing on the data that matters.
Here is a simple real-world example.
In the picture below, we are looking at the Conviva UI for a live sports app, specifically tracking an experience metric called Login Processing Time in the lead up to a big event. This metric measures the time taken to complete the login process after the user has entered their credentials and clicked login. It would include any SSO integration, third party authentication checks, and other activities to complete the login process and bring up a working application. It’s important to note that this is not as simple as measuring the response of a single API call.

While monitoring the metric, we see a sudden spike just before the event is about to start. Because we are directly measuring Login Processing Time, we immediately know that users are impacted and how many are impacted.
With just two clicks, in the picture next page, we determine that only users on a specific iPhone 15 version and on two specific device models are experiencing the login problem.
If not addressed immediately this would cause a major disruption for users attempting to watch the event causing churn and brand damage. Because we are directly measuring Login Processing Time, we immediately know that users are impacted and how many are impacted. With just two clicks, in the picture above, we determine that only users on a specific iPhone 15 version and on two specific device models are experiencing the login problem.

With two more clicks, in the picture below, we pinpoint a slow call to a third party authentication service. In this case, no amount of meticulous backend monitoring would have helped us locate root-cause, as it is a third-party issue. With user-centric operational monitoring, however, we easily connected the dots from Login Processing Time to the specific device models to the specific network call, leaving us with a clear understanding of the issue and its impact, and a concrete action to resolve the issue.

A new operational methodology
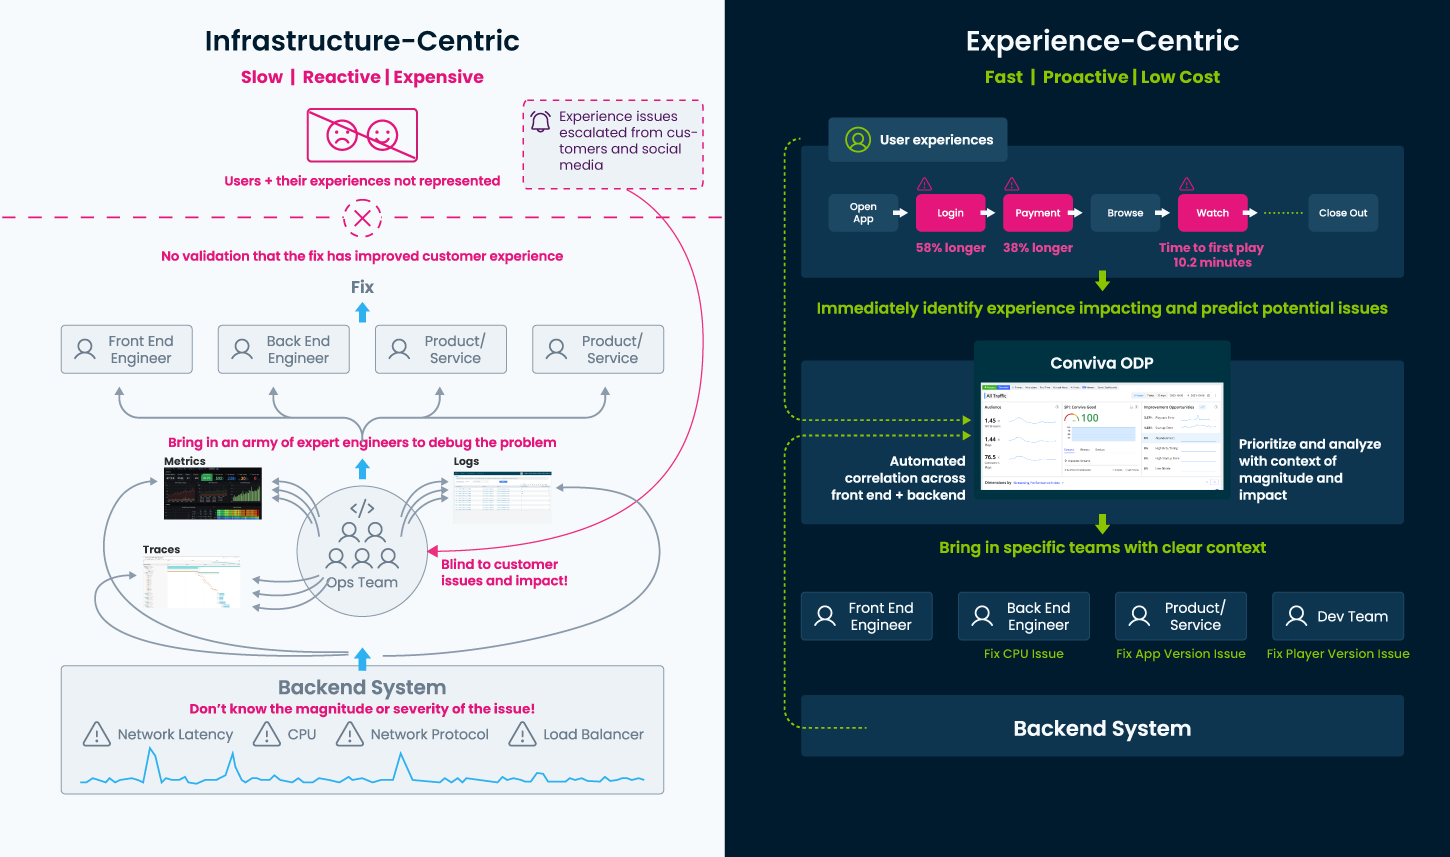
Experience-Centric Operations is a new way of thinking and does take some getting used to. As with all paradigm shifts, there must be a significant benefit. Figure 3 illustrates this difference and the massive benefit. On the left is the current paradigm with an infrastructure-centric approach. Monitoring is primarily from backend systems through logs, metrics, and traces. Ops teams monitor these regularly, but surprises still happen and many experience issues still go under the radar. When an escalation comes from customers or social media, it triggers a frantic search for potential issues. There is no understanding of the magnitude or impact of the issue, nor clear guidance on priority.
This means that in many cases the ops team and an army of expert engineers across multiple areas of the system are brought in to diagnose the issue. Eventually, when an issue is found and fixed, the team is not sure if the customer problem is resolved or not since there is no direct monitoring of customer experience. This approach leads to more customer impact and higher cost.
The right side of the figure is how things work in an Experience-Centric approach. There is an equal emphasis on measurement of user experience and system performance. When user experience is impacted, the issue is immediately and automatically detected and then diagnosed by correlating with system performance, pinpointing the component or components causing the issue. This means the issue can be resolved quickly and with just a few team members. The team only has to look at the data that matters, which reduces cost. As the monitoring system learns patterns of system performance that impact user experience, it can start to predict experience-impacting issues before they happen and classify system performance issues as customer-impacting or noncustomer-impacting to aid prioritization and investment.
A new paradigm of technology
Unfortunately, existing observability tools are not capable of solving the disconnect between experience and performance or enabling an experience-centric approach to operations. They cannot measure experience metrics like Login Processing Time continuously in real-time and cannot connect them to performance causes. A new paradigm of technology is needed to unlock Experience-Centric Operations. This technology must support a flexible and easy way to compute experience metrics across all users in real-time, automatically alert on these metrics based on anomalies, then connect them to performance in the client and in the backend to quickly diagnose them. Each of these actions is individually very valuable, but together they enable a transformation that dramatically improves user experience and reduces operational cost.
Observability Tools Cannot Bridge the Experience Disconnect
Today’s monitoring tools focus almost exclusively on backend servers and applications. Unfortunately, this means ops teams are completely disconnected from the user experience, leaving them guessing in the dark and with no context on how to prioritize. When an escalation comes in because users can’t sign up, an army of expert engineers must be brought in to find the issue, interrupting their high value work. Since there is no clear path through the data to the root cause, even the engineers are reduced to guesswork and scouring all the systems in the path of sign up for some solution. This is slow, expensive, and disruptive. Once they do find a probable cause, make some time, and fix it, they still don’t know for sure if they addressed the real problem since there is no direct validation of user experience.
The disconnect from user experience and the need to find a way to measure it directly is a known problem for companies, and observability tools have been trying to address it with two approaches.
-
- By ingesting more data from backend servers and applications, observability solutions hope to capture a higher percent of user-impacting issues. This means capturing more logs, more metrics, and introducing traces or capturing more traces. This bloat has led to higher costs for companies, without ultimately solving their problem: it is simply not possible to understand experience from backend sources alone.
- Observability solutions introduced Real User Monitoring (RUM) tools to try to capture user experience. RUM unfortunately falls noticeably short in solving the problem, as the tools are built on severely limited technology, which is expensive to use, lacking in functionality, and only capable of running on a small sample of users. Read more about the limitations of RUM tools here.
Neither of these costly approaches is capable of solving the performance-experience disconnect. It continues to be a major stress point for companies because, despite the human, technological, and financial resources being thrown at the problem, surprise escalations are still happening every day, stealing expert engineers away from innovation for the business.
What’s the problem with legacy observability tools?
The biggest drawback is fundamental: today’s solutions cannot compute true experience metrics in real-time because they simply do not have the foundational technology needed for the task. All these tools are built merely to count events, such as crashes, errors, page loads, etc.—and even this they struggle to accomplish at scale.
Experience, however, cannot be computed as a simple count of events. Understanding the complexities of the user journey requires us to compute complex metrics based on timing, time intervals, sequences, and state. We refer to this entire process as stateful analytics or a metric based on this as stateful metric.
Let’s look at this more in-depth:
A count of errors is a stateless metric. It does not depend on understanding sequences, time intervals, or state.
Time to Sign Up is a stateful metric (granted, a fairly simple one, but RUM tools cannot even compute this). It can be considered stateful because the monitoring system must identify the start and successful completion of signup for a particular session (a process we call sessionization), then compute the time difference between the two for each session, then aggregate them across sessions—all in real-time.
We can introduce a new level of complexity to the Time to Sign Up metric by excluding any time spent outside the app. Let’s say the user received a text while signing up, so they spent a minute in their messaging app responding to it in the middle of the sign-up process. This minute should be excluded from the Time to Sign Up metric. You can see how the user session rapidly becomes much more complex than simply calculating time between two events.
Maybe you’re asking why you couldn’t simply compute the Sign Up metric in the client and send it as an event. While this may sound feasible at first, it does not work in practice, because computing all the relevant stateful metrics in the client across all device types and variations of user flows and versions and maintaining this over time creates too high an overhead, leading to inaccurate metrics and lack of trust while deteriorating client performance. Even when companies commit to this approach with all seriousness, they are quickly forced to abandon it, leaving the ops team where it began—stuck with low-level performance visibility and no understanding of the user experience.
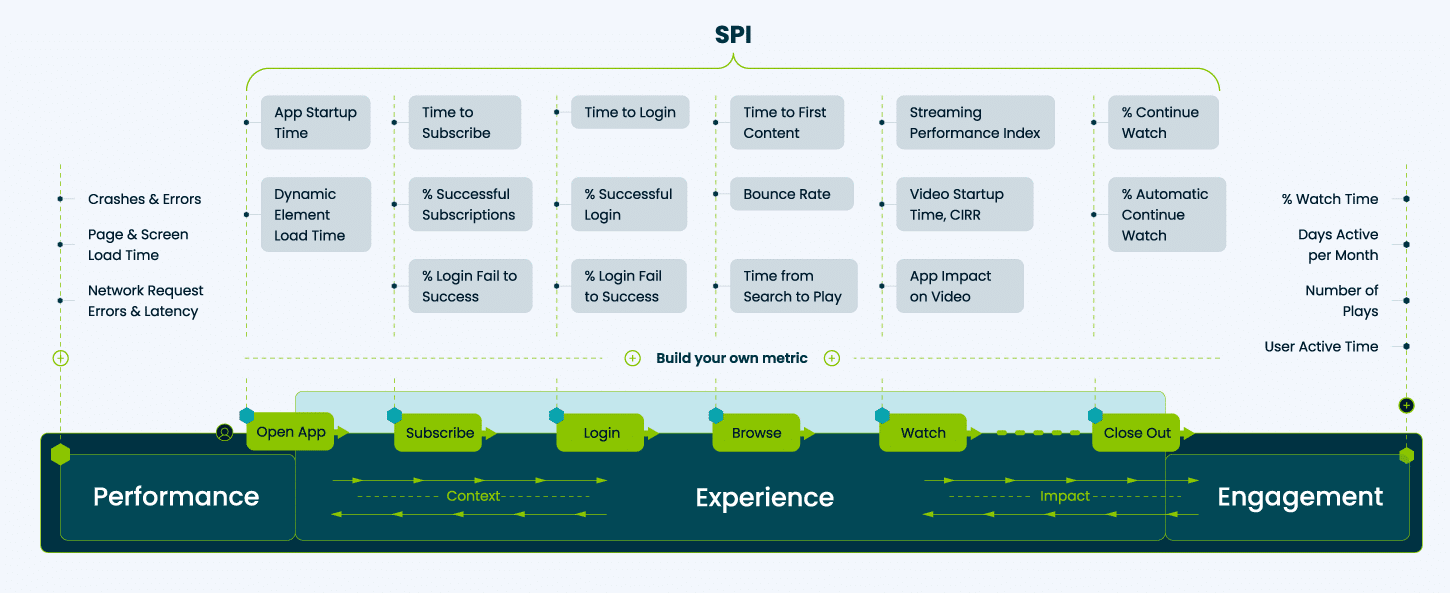
The figure below shows what we mean by experience metrics for a video streaming app. On the left are low-level performance metrics (the focus of RUM tools). In the middle are critical experience metrics, categorized by each part of the user flow.
On the right are engagement metrics (the focus of product analytics). A comprehensive understanding of user experience requires measuring all three in real-time in a connected manner:
-
- Engagement reflects outcomes that matter for the business. It helps us understand the impact of experience and define what a good experience is.
- Performance helps to diagnose why we have an experience issue.
- Experience is the connection between performance and engagement. It is the most important missing piece in every business today and it cannot be supplied by today’s observability tools.
Experience-Centric Unified Monitoring & Analytics
Transform critical experiences, performance, and engagement into real-time operational metrics
Conviva’s Approach to Experience-Centric Operations & Stateful Analytics
Conviva’s approach to building a platform for Experience-Centric Operations involves two key technologies: 1) A thin SDK (we call Sensor), which is a new approach to collecting data from application endpoint, and 2) Time-State Technology, which is a new abstraction and system for efficient, real-time, and stateful data processing at scale.
Thin SDK Strategy Enables Light-Weight and Accurate Monitoring of Experience
The first challenge on the way to connecting user experience to system performance is the need to deploy an SDK, which is the last thing any app development team wants to do.
We get this. We’ve lived this reality for 15 years as we currently manage about 7 billion SDK instances across thousands of apps and device models, web browsers, phones, tablets, smart TVs, set-top boxes, game consoles, and even cars. From this experience, we can say with confidence that it’s not possible to avoid collecting data from the app when you’re trying to measure true user experience. What we also know, however, is that we can do much better than all the RUM and product analytics SDKs out there.
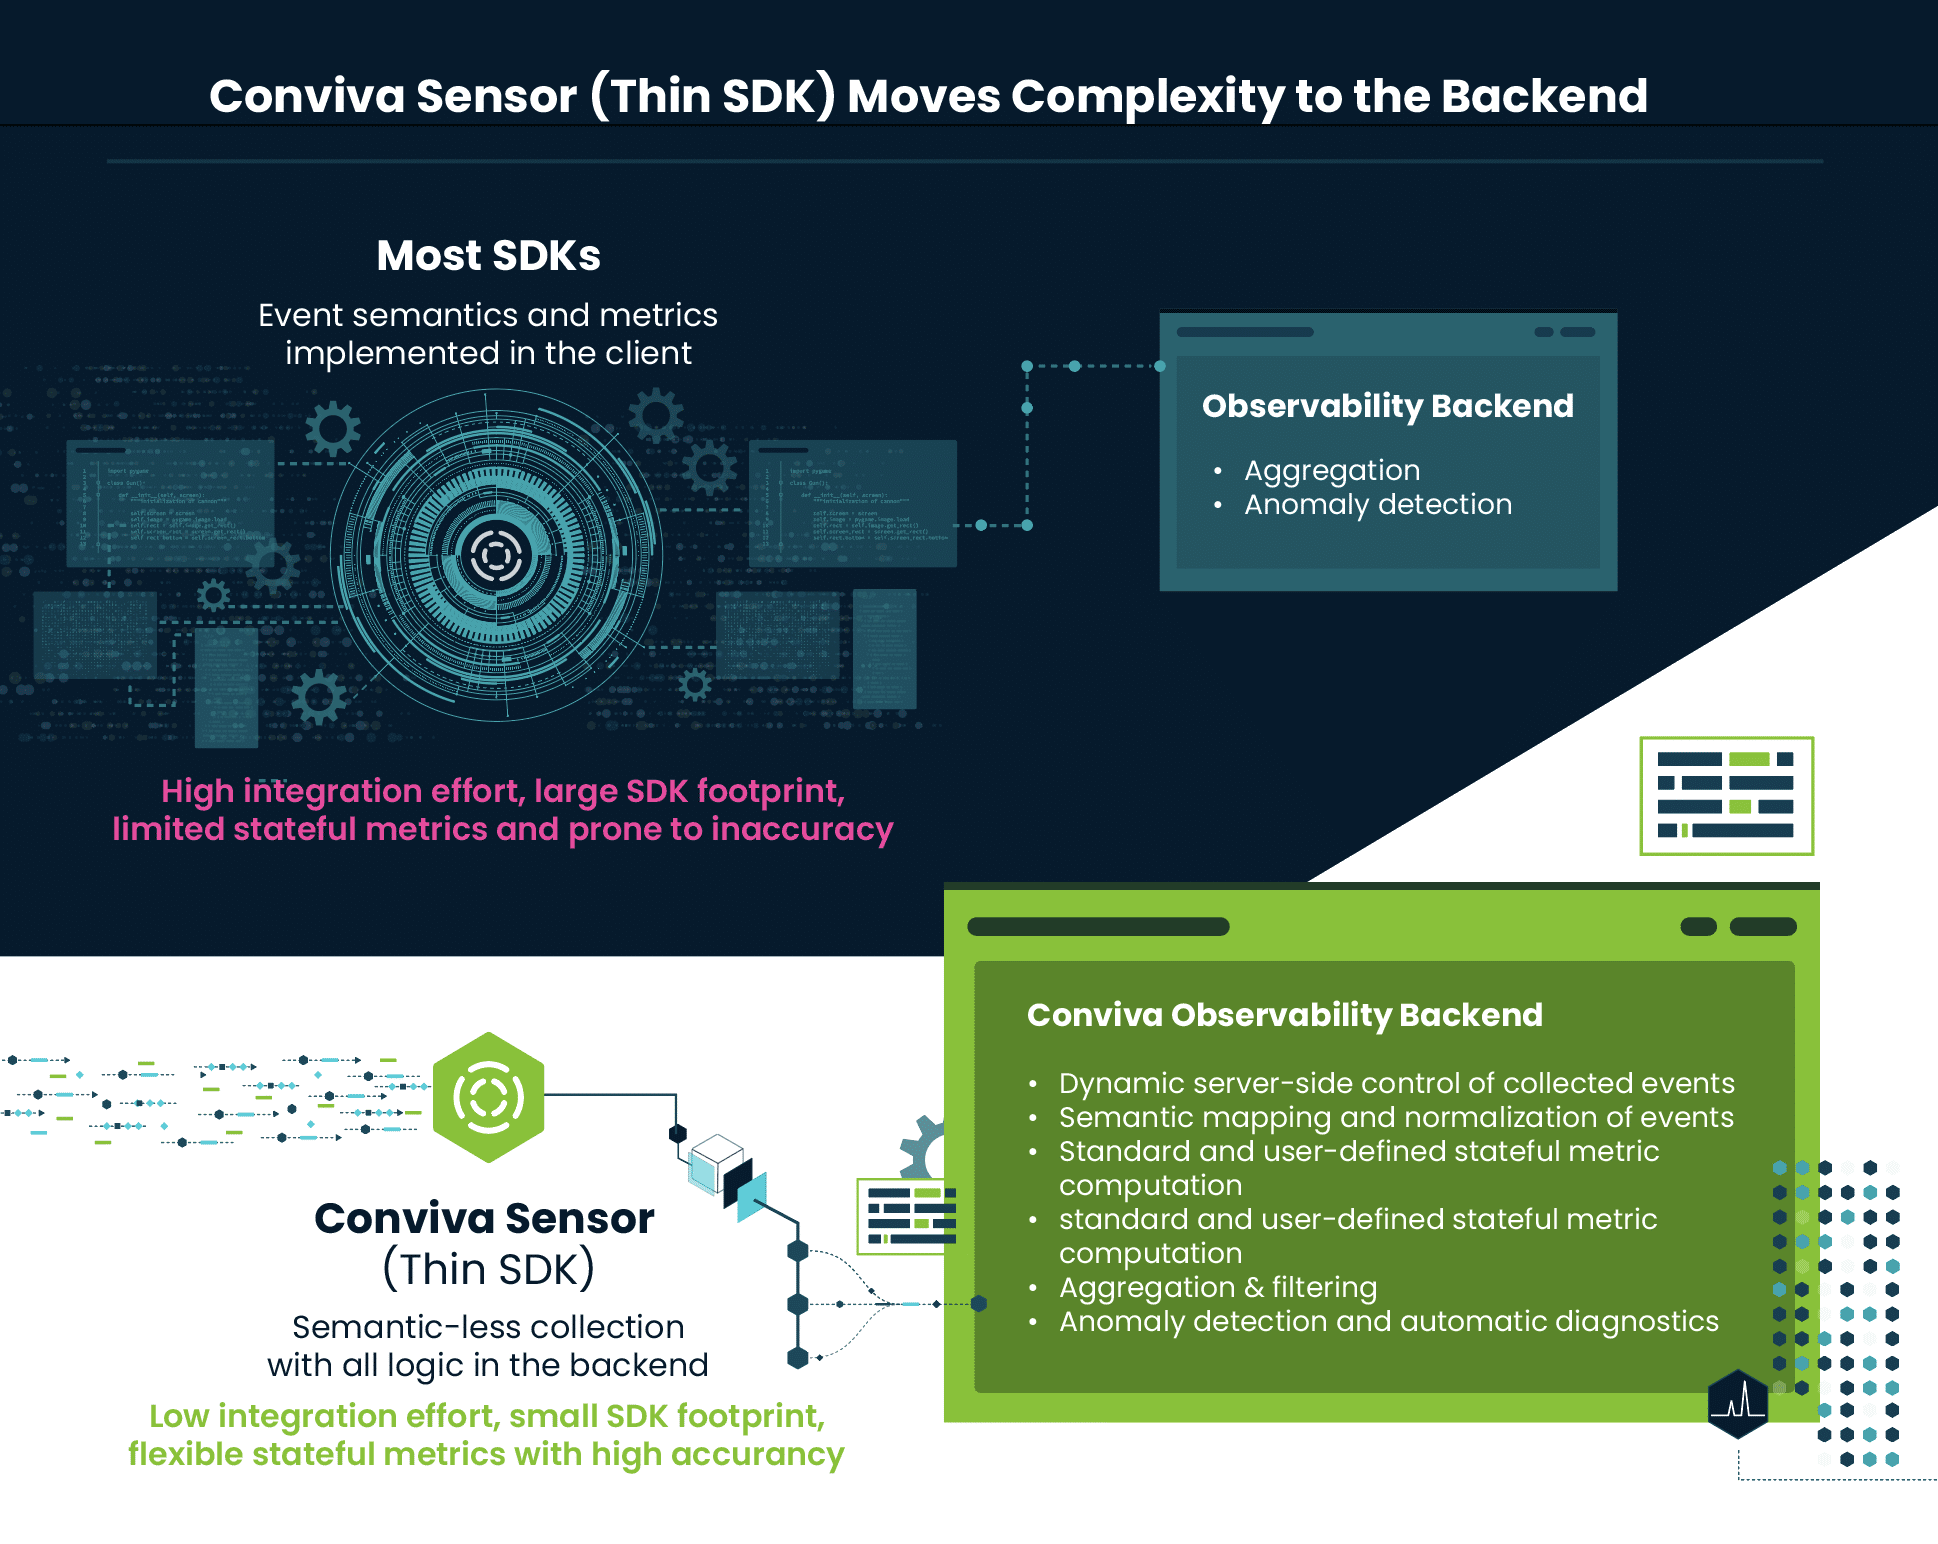
The number one lesson we’ve learned regarding SDKs is that they have to be extremely simple and do as little work as possible. This means we must resist doing any computation or manipulation of data in the SDK. This is counterintuitive because at first glance, it seems like the cheaper option, since we’re using the device’s CPU cycles instead of our backend, and the easier option, since the metrics are directly applied to the data. In reality, though, this make the SDK heavier, which slows down the app, and more prone to obsolescence, since the metric implementation will fall out of date and become inaccurate for weeks or months at a time, before an update can be applied. If you’re computing 20 metrics across a dozen device types, that’s 240 metric implementations that could be outdated and even erroneous.
To solve this, our SDK only collects events without enforcing any semantic schema. We ingest the events exactly as they are exposed by the device OS and your app. This means developers don’t have to instrument each event like they would if they wanted to process the data in Adobe or Google Analytics or if they were sending custom events to a RUM tool. Instead, they can simply connect their app to the Conviva platform through our SDK, and we can pull in all event data without sampling. The magic here is that the developers can then control which events they want to pull in, map and rename events, and create any stateful (or stateless) metric from these events—all in the backend.
This approach does mean we are taking on a lot more processing load on our backend than other systems. Dynamic event mapping and stateful metric computation were not actions existing tools could do in real-time at the scale of millions of endpoints, but they were the actions we needed to accomplish to solve Experience-Centric Operations. It turns out no big-data technology (open source or proprietary) could handle what we needed, so we had to create it completely from scratch.
Time-State Technology Enables Experience-Centric Operations
Let’s restate the problem facing businesses in the digital environment: they need the ability to do stateful metric computation in the big-data backend in real-time at the scale of millions of endpoints, and it must be cost-effective enough to be a practical solution for operations.
We tried to solve this problem with every major big-data platform—Spark, Flink, Kafka, Druid, Clickhouse, etc. None of them can address the entire issue on their own. They offer good components for a solution, but they are not capable of being the core engine to compute stateful metrics from raw event streams in real-time with high scale and efficiency.
This realization led us to dive in and really understand why this is the case, which led us to a key insight: the problem is not the systems themselves; the problem is the abstraction that every one of them is built on—the tabular abstraction dating back decades, which is at the core of every database and big-data system. The tabular abstraction represents every point of data as rows and columns in a table, with operators for manipulating the data. We found that the tabular abstraction is not good for stateful analytics.
This realization gave us the freedom to innovate at a foundational level, which ultimately led us to create a new abstraction, called Timeline, and our Time-State Technology, which represents all event stream data as timelines with a set of timeline operators to compute stateful metrics.
Timelines offer a more efficient way to write queries compared to the conventional approaches which we tried and found lacking, including streaming systems, timeseries databases, and time-based extensions to SQL. As a result, Timelines can model dynamic processes more directly than any of those pre-existing approaches and express the requirements of time-state analytics easily and intuitively. To support this new abstraction, we’ve also codified the concept of Timeline Algebra, which defines operations over three basic Timeline Types: state transitions, discrete events, and numerical values. If you’re interested in the details of Time-State Technology, read more here.
Our results speak for themselves
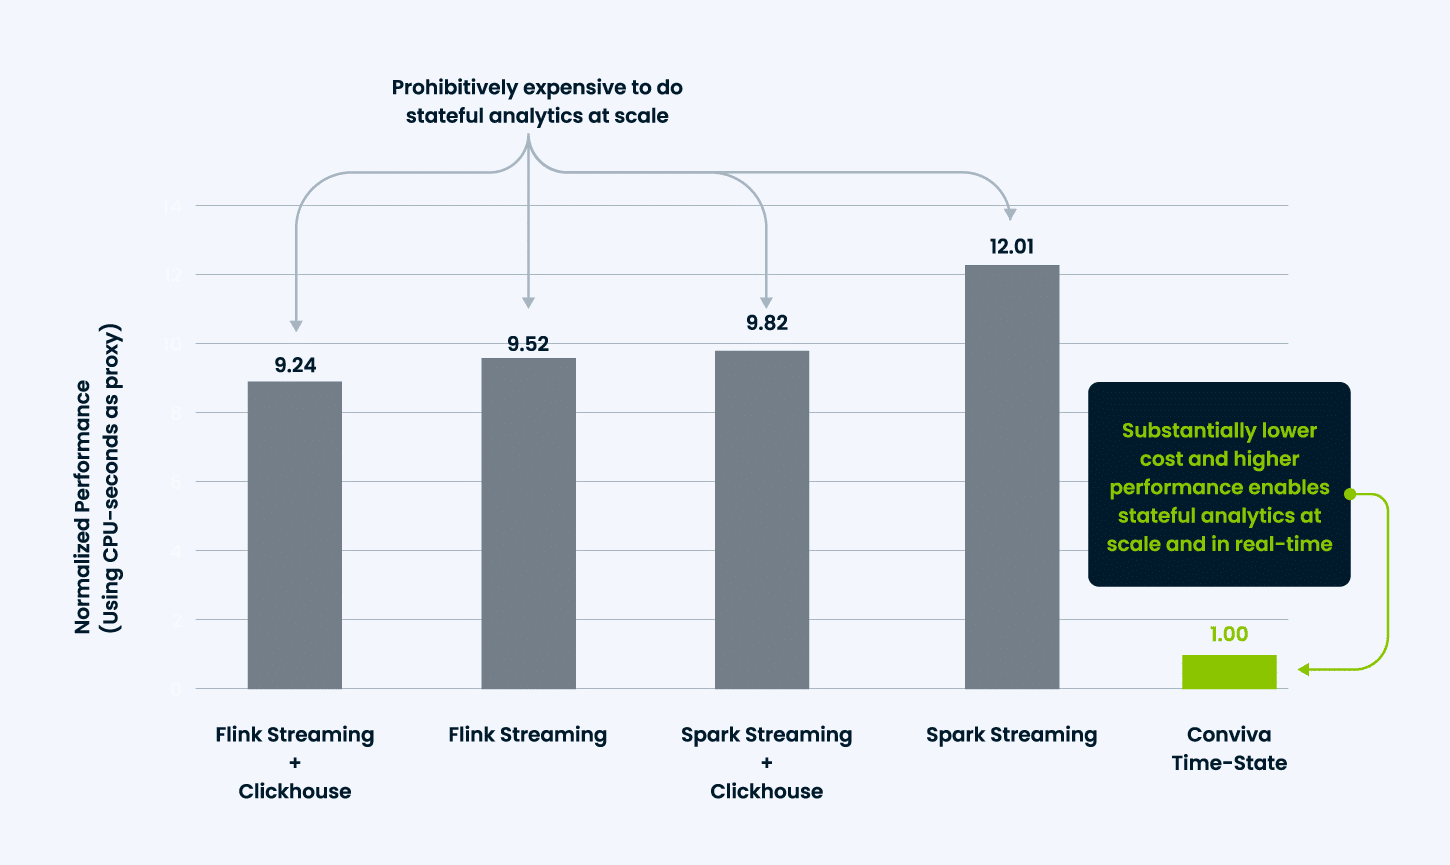
To give you a taste of the performance gains we are getting with our Time-State Technology, Figure 4 shows a benchmark of our performance compared to the state-of-the-art big-data platforms. This is our first iteration of the Time-State model, and we have many ideas to further optimize, but we have already seen approximately 10x better performance compared to the SQL-based solutions, which is a key enabler for making Experience-Centric Operations a reality.
