

 Conviva Leadership


Convivaは、ストリーミングメディア向けのインテリジェンスクラウドです。
180カ国でのデバイス上の33億のアプリケーションにて視聴される1日当たり 1.8兆のリアルタイムイベントから、コンテンツ、ソーシャルメディア、広告配信における視聴体験を分析しています。2021年第1四半期のアジア地区におけるストリーミング状況に関するレポートでは、アジア全体のストリーミング状況の詳細より、以下、中国、香港、日本、北朝鮮、韓国、マカオ、モンゴル、台湾を含む東アジアのハイライトをご報告します。
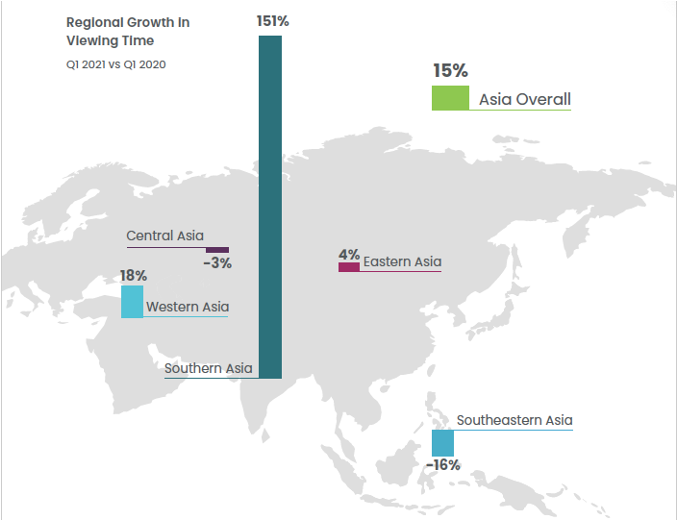
対象地区における視聴時間の伸長:
概要として、2021年第1四半期 (1月〜3月)、アジア全体でのストリーミング視聴時間は、去年同時期と比べ、15%増加し、日本を含む東アジアでは、前年比4%の緩やかな成長を記録しました。
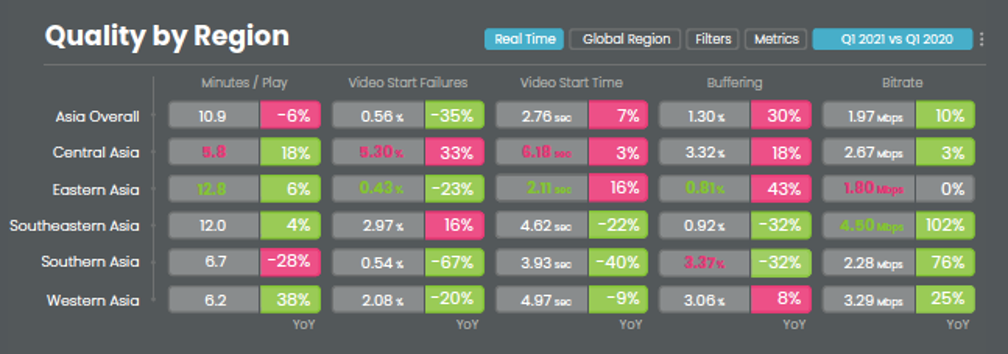
配信品質の地域間での差異:
アジア全体での配信品質は2021年第1四半期で多様性を示すものでした。日本を含む東アジアは2021年第1四半期、他地域よりも全体的に最も良い配信品質を実現していますが、大画面TVでの視聴割合が他地域より低いため、ビットレートが低い傾向が見受けられます。
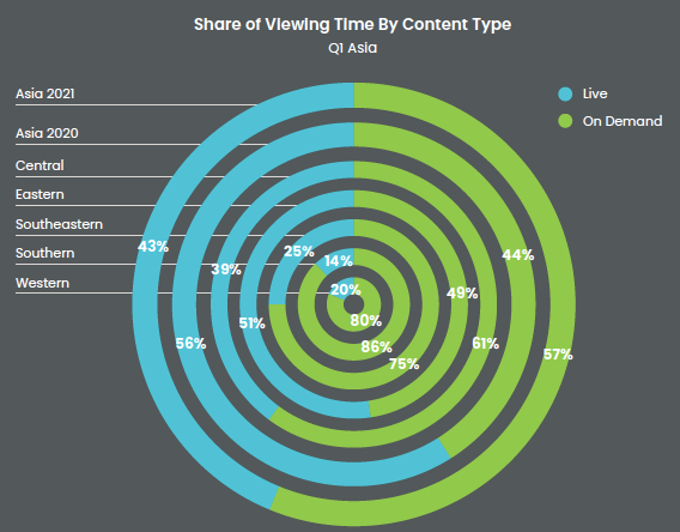
コンテンツタイプごとの視聴時間の伸長:
アジア全体では、オンデマンド (VoD) 視聴が前年比で49%増加し、ライブストリーミングが11%減少しました。転じて日本を含む東アジアでは、ライブ視聴が16%減少し、オンデマンド視聴が 37%増加しましたが、ライブ視聴が51%, VOD視聴が49%と、2021年にライブがより多く視聴された唯一の地域になっています。
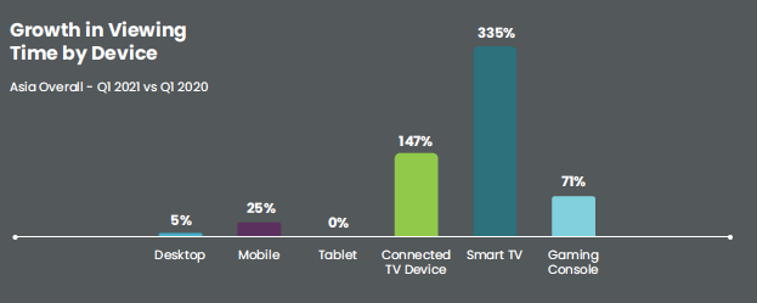
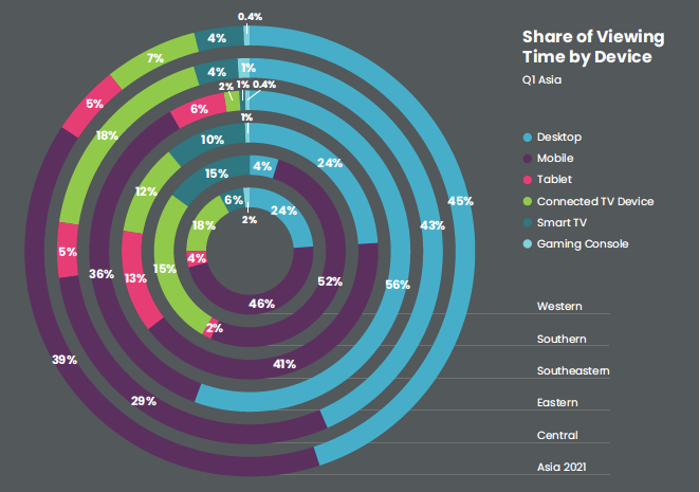
デバイス別の視聴時間シェア:
自宅の大画面TVでのストリーミング視聴傾向はアジアでも当てはまり、去年の同時期よりスマートTV、インターネット接続テレビ、ゲーム機での視聴が増加しました。スマートTVは、前年比335%の視聴時間増があり、インターネット接続テレビも前年比147%の視聴時間増になりました。
アジア vs 世界における大画面TV視聴:
大画面TVでの動画視聴はアジアを含め、世界中で急速に成長していますが、アジアでの視聴デバイスは世界と異なる傾向にあり、Android TVが全視聴時間の約半数を占めています。2021年の第1四半期では、2位のAmazon Fire TV – 26%、次いでSamsung TV – 7%、LG TV – 6%、Play StationとChromecast – 3%, Apple TV – 2%のシェアを示しました。北米で主流のRokuはグローバルの大画面視聴で30%のシェアを獲得しましたが、アジアでは第1四半期のシェアのわずか1%だけにとどまりました。
アジアのスポーツリーグの回復と現在:
アジアのスポーツリーグは、COVID-19の影響を受けた前年に比べ、2021年第1四半期ではソーシャルメディアが大幅に伸長しました。

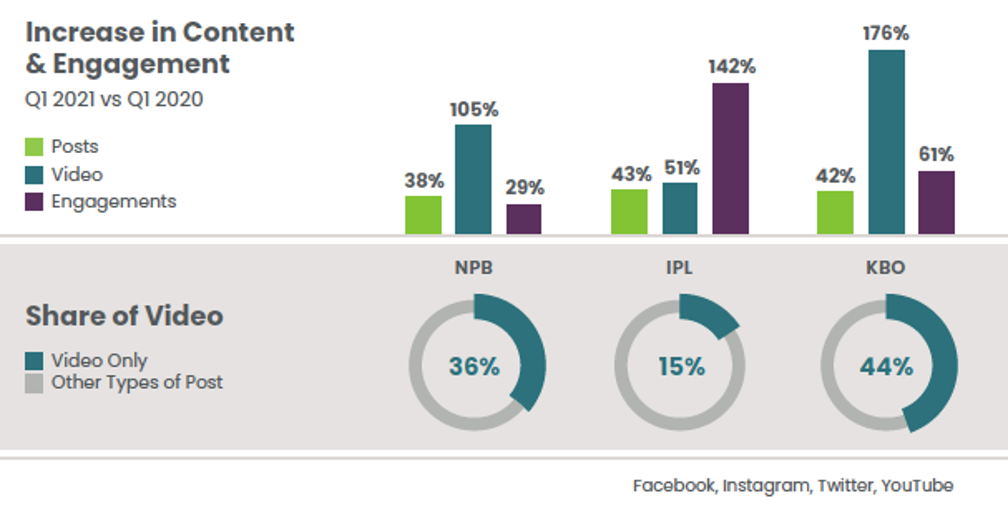
韓国プロ野球リーグ (KBO) が前年比、動画投稿が175%増加し、全体エンゲージメントが60%増加しました。
日本プロ野球リーグ (NPB) も前年比、動画投稿が105%増加し、エンゲージメントも29%の増加するなど、大きな回復を遂げています。
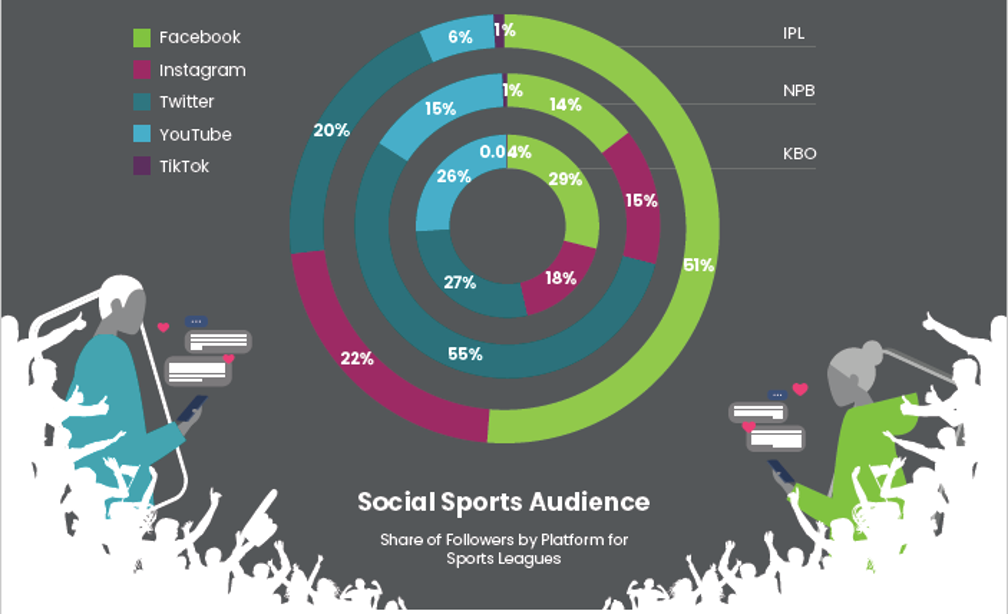
アジアにおける、ソーシャルメディアでのスポーツ視聴のユニークな分布:
NPBとKBOは世界の他スポーツリーグと比べ、ユニークなソーシャル視聴分布を示しています。
NPBは、2021年にConvivaで計測したうちで, YouTubeでの視聴シェアがFacebookより高い唯一のリーグで、KBOは、2021年にConvivaで調査した米国やヨーロッパを含むスポーツリーグの中で 、最も高いYoutube視聴者シェアを記録しています。
全てのストリーミングトレンド情報を入手するには、 Conviva’s State of Streaming Q1: Asia 全文をダウンロード下さい。
本レポートのデータについて:
Conviaのストリーム状況レポートのデータは、現在33億のストリーミング動画アプリにインテグレートされているConvia 独自のセンサーテクノロジーから収集され、180カ国以上からの5億人以上のユニークな視聴者が年間1800億ストリーム視聴をし、一日当たり1.8兆のリアルタイム・トランザクションに基づくものです。業界の成長を正しく把握為、顧客単位で前年データと比較しています。ソーシャルメディアのデータは、Facebook、Instagram、TikTok、Twitter、YouTube からの900超のアカウント、180万超の投稿、91万動画、60億の動画再生、350億超のエンゲージメントより構成されています。
—
Q1 2021 State of Streaming: Asia Recap Summary
Conviva is the intelligence cloud for streaming media. We analyze content, social media, advertising, and quality of experience, including 1.8 trillion real-time events per day via 3.3 billion applications streaming on devices in 180 countries. In our State of Streaming Q1 2021 Asia report, we shared details of the status of the streaming industry across Asia. Here is a summary of Eastern Asia, which includes China, Hong Kong, Japan, North Korea, South Korea, Macau, Mongolia, and Taiwan.
Eastern Asia Highlights
Regional growth in viewing time
Overall, time spent streaming in Asia grew by 15% in Q1 2021 versus Q1 of last year. Eastern Asia tallied a moderate growth of 4% year over year.
Regional quality variance
Quality was mixed for Asia in Q1 2021, but Eastern Asia delivered the best overall quality of any region in Q1 2021, only lagging in bitrate which is expected with the smaller percentage of big screen viewing in the region.
Growth in viewing time by content type
Viewers in Asia continued the trend of watching what they want when they want to drive on-demand viewing up 49%, while live streaming fell by 11%. However, Eastern Asia had a 16% decrease in live viewing and a 37% increase in time spent watching on demand. It was the only region where more live content was watched in 2021, a 51% to 49% split.
Share of viewing time by device
While people are streaming more, more and more, they are at home on larger screens. The same held true for Asia, where smart TVs, connected TV devices, and gaming consoles saw the most growth over Q1 of last year. Smart TVs made massive gains with a 335% increase. Connected TV devices also saw triple-digit growth at 147%.
Big screens in Asia vs Global
Big screens have the fastest growth of any device worldwide, including in Asia. But Asia’s device choices when streaming on big screens differ greatly from global patterns. Android TV dominated viewing in Asia with nearly half of all time spent. Amazon Fire TV came in second with 26%, and was followed by Samsung TV at 7%, LG TV at 6%, PlayStation and Chromecast both at 3%, and Apple TV at 2% share in Q1 2021. Roku, a powerhouse in North America, captured a significant 30% share of global big screen viewing time, but it barely made a blip in Asia with just 1% share in Q1.
Sports leagues in Asia on the rebound, for now
Sports leagues in Asia rallied with significant improvements on social media in Q1 2021 as compared to the previous year, when Asia one of the first regions to experience the impacts of COVID-19.
In baseball, the Korea Baseball Organization (KBO) in South Korea showed a 175% increase in video posts and a 60% increase in total engagements compared to Q1 2020.
Nippon Professional Baseball (NPB) in Japan was also able to make a great recovery with 105% more videos posted in Q1 2021 than the year prior with a 29% increase in total engagements.
The unique distribution of social sports audience in Asia
NPB and KBO are both unique in the distribution of their social audience compared to other sports leagues around the world. The NPB was the only league we’ve measured at Conviva in 2021 that had a higher share of audience on YouTube than on Facebook, and the KBO had the largest audience share on YouTube of any sports league we’ve researched at Conviva in 2021, including all American and European leagues.
To get details on all the streaming trends, download Conviva’s State of Streaming Q1 2021: Asia.
Methodology
Data for Conviva’s State of Streaming report was primarily collected from Conviva’s proprietary sensor technology currently embedded in 3.3 billion streaming video applications, measuring in excess of 500 million unique viewers watching 180 billion streams per year with 1.8 trillion real-time transactions per day across more than 180 countries. Year-over-year comparisons were normalized at the customer level for accurate representations of industry growth. The social media data consists of data from over 900 accounts, over 1.8 million posts, 910 thousand videos, 6 billion video views, and over 35 billion engagements across Facebook, Instagram, TikTok, Twitter, and YouTube.


