

 Conviva Leadership


Conviva는 미디어 스트리밍을 위한 지능형 클라우드입니다. 당사는 180개국의 33억 개의 디바이스에서 스트리밍되는 애플리케이션을 통해 매일 1조 8천억 개의 실시간 이벤트를 비롯하여 컨텐츠, 소셜 미디어, 광고 및 경험의 질을 분석합니다. 2021년 1분기 스트리밍 상태 아시아 보고서에서 당사는 아시아 지역의 스트리밍 산업 현황에 대한 세부 정보를 공유하였습니다. 다음은 중국, 홍콩, 일본, 북한, 한국, 마카오, 몽골 및 대만을 포함하는 동아시아 보고서의 요약서입니다.
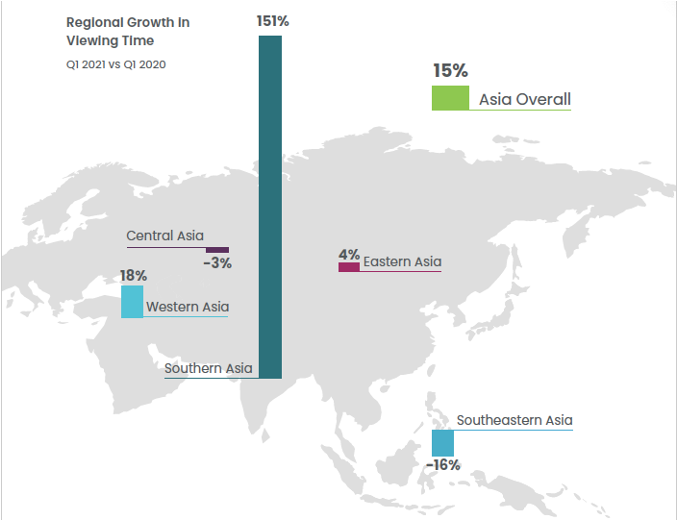
시청시간의 지역별 성장:
전반적으로 아시아에서 지난 1분기 대비 2021년 1분기에 스트리밍 시간은 15% 증가했습니다. 동아시아는 전년 동기대비4%의 완만한 성장을 기록했습니다.
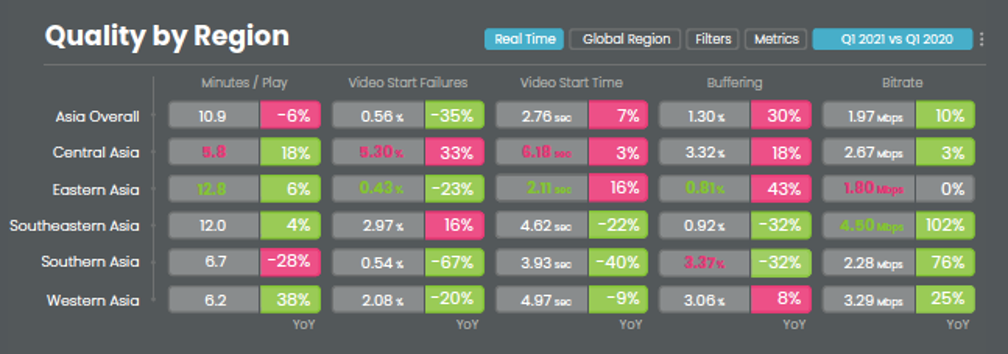
지역별 품질 차이:
2021년 1분기에 아시아 지역의 품질은 불균일 한 것으로 조사되었는데, 동아시아 지역은 2021년 1분기에 최고의 품질을 전달하며 비트레이트에서만 약간 뒤처진 결과를 기록했는데 이 지역에서 대형 스크린 시청률의 아주 작은 비율에서만 발생할 것으로 예상되었습니다.
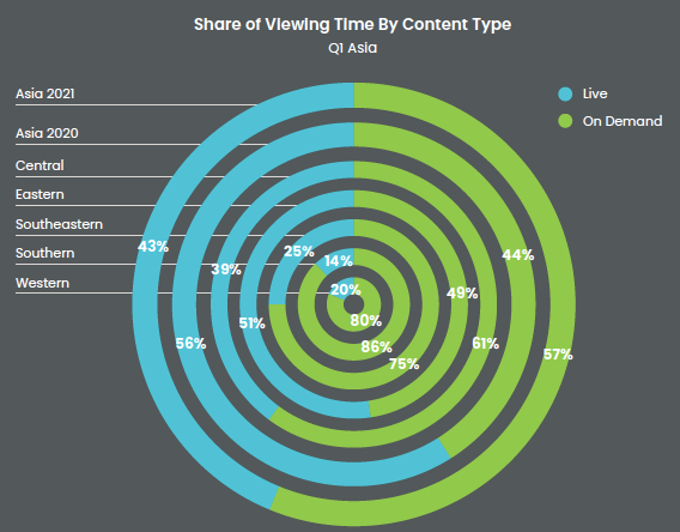
콘텐츠 유형별 시청시간 증가:
아시아 시청자들은 원하는 컨텐츠를 원하는 시간에 시청하는 온디맨드 트렌드가 계속되어 온디맨드 시청률은 49% 증가된 반면에 라이브 스트리밍은 11% 하락했습니다. 그러나 동아시아에서는 라이브 시청률이 16% 감소했고, 온디맨드 시청 시간이 37% 증가했습니다. 2021년에는 각각 51%-49%로 아시아는 라이브 콘텐츠를 더 많이 시청한 유일한 지역이었습니다.
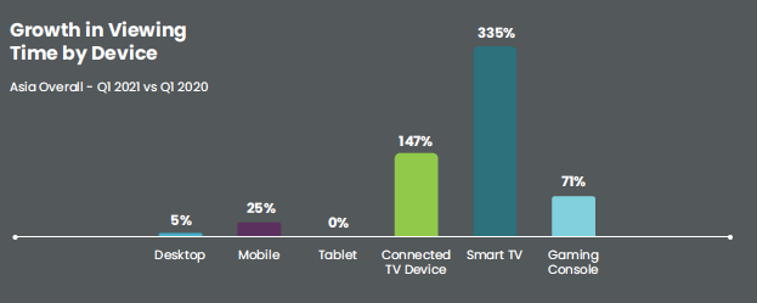
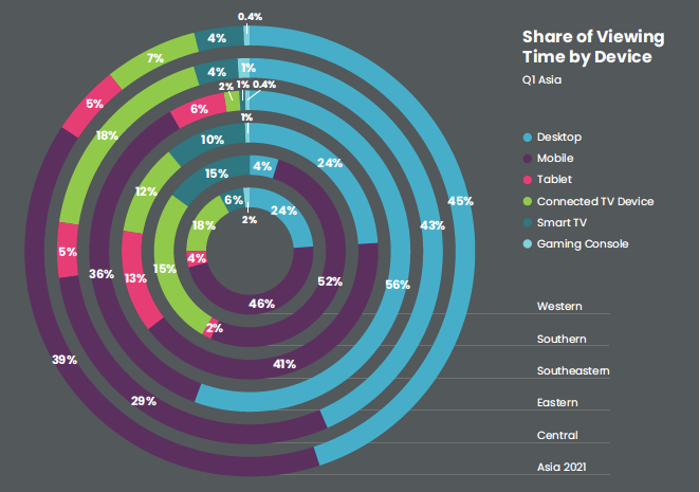
디바이스별 시청 시간:
사람들이 점점 더 많이 스트리밍을 할수록 스크린의 크기도 점점 커집니다. 이러한 현상은 아시아에서도 동일하게 나타나 스마트 TV, 커넥티드 TV 디바이스, 게임 콘솔에서 작년 1분기에 비해 가장 높은 성장세를 보였습니다. 스마트 TV는 335%의 괄목할 만한 증가세를 기록했습니다. 커넥티드 TV 디바이스도 147%의 세 자릿수 성장을 기록했습니다.
아시아 대형 스크린 vs 글로벌 대형 스크린:
아시아를 포함한 전 세계에서 대형 스크린은 모든 디바이스 가운데 가장 빠르게 성장하고 있습니다. 그러나 대형 스크린에서 스트리밍할 때 아시아에서의 디바이스의 선택은 글로벌 양상과 많이 다릅니다. 안드로이드 TV는 아시아 지역에서 시청률의 절반을 차지하고 있습니다. 이어서 2021년 1분기에는 아마존 파이어TV가 26%로 2위를 차지했고, 삼성TV가 7%, LGTV가 6%, 플레이스테이션과 크롬캐스트가 각각 3%, 애플TV가 2% 순이었습니다. 북미의 강자인 Roku는 전 세계 대형 스크린 시청 시간의 30%를 차지했지만, 아시아에서는 1분기에 1%의 점유율로 아주 작은 비중에 그쳤습니다.
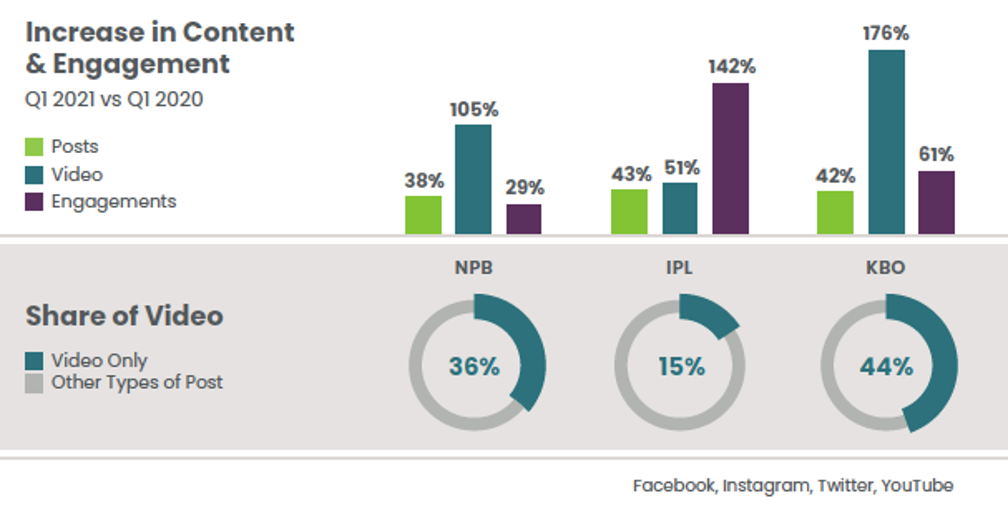
아시아에서 스포츠 리그 부활:
COVID-19의 영향을 가장 먼저 경험한 지역 중 하나인 아시아에서, 아시아 지역 스포츠 리그는 2021년 1분기에 전년대비 소셜 미디어 부문에서 크게 개선되면서 반등했습니다.

야구의 경우, 한국야구위원회(KBO)는 2020년 1분기에 비해 비디오 게시물이 175%, 전체 엔게이지먼트가 60% 증가했습니다.
일본프로야구(NPB)도 2021년 1분기에 전년보다 105% 많은 비디오가 게시되었고, 전체 엔게이지먼트가 29% 증가하며 큰 회복세를 보였습니다.
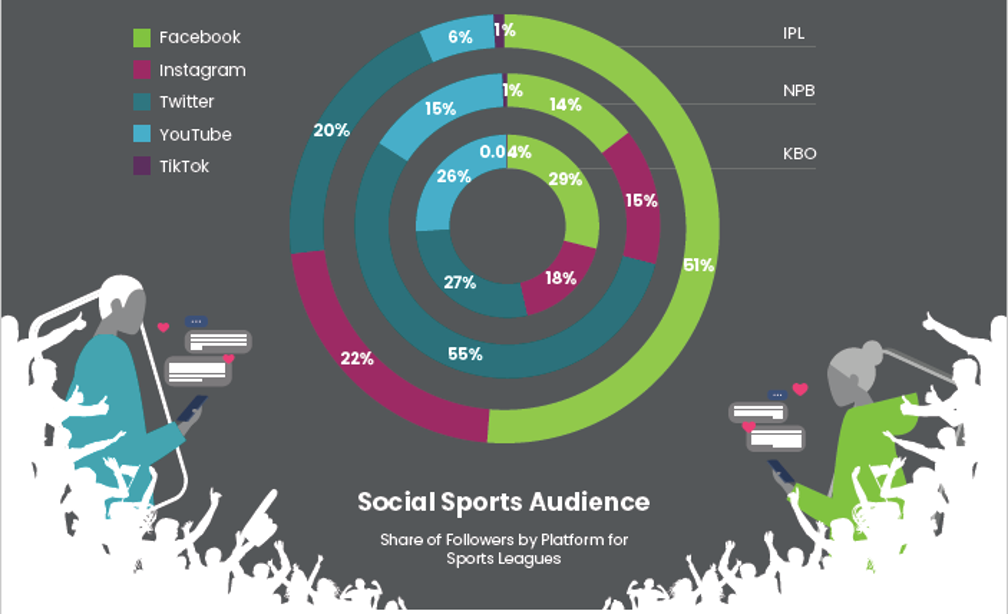
아시아의 독특한 생활 스포츠 관람객 분포:
NPB와 KBO는 모두 전세계에 있는 다른 스포츠 리그와 비교했을 때 사회적 관람객 분포가 독특합니다. 2021년 Conviva에서 측정한 바에 따르면 미국과 유럽 리그들을 포함한 전체 리그 중 페이스북보다 유튜브 시청률이 높았던 리그는 NPB가 유일했고, 2021년 Conviva에서 조사한 스포츠 리그 중 유튜브 시청률이 가장 높은 리그는 KBO였습니다.
모든 스트리밍 트렌드에 대한 자세한 내용을 보려면 Conviva의 2021년 1분기 스트리밍 상태 보고서: 아시아 를 다운로드하십시오.
방법론:
Conviva의 스트리밍 상태 보고서의 데이터는 현재 33억 개의 스트리밍 비디오 애플리케이션에 내장된 Conviva의 독점 센서 기술로부터 수집되었으며, 180개가 넘는 국가들에서 연간 1,800억 개의 스트리밍을 시청하고 하루 1조 8,000억 개의 실시간 트랜젝션을 기록하는 5억 명이 넘는 고유 시청자를 분석을 통해 도출되었습니다.
업계 성장을 정확하게 표현하기 위해 고객 수준에서 전년대비 데이터를 표준화했습니다. 소셜 미디어 데이터는 페이스북, 인스타그램, 틱톡, 트위터 및 유튜브에서 900개 이상의 계정, 180만 개 이상의 게시물, 91만 개의 비디오, 60억 개의 비디오 뷰, 350억 개 이상의 계약으로 구성됩니다.
Q1 2021 State of Streaming: Asia Recap Summary
Conviva is the intelligence cloud for streaming media. We analyze content, social media, advertising, and quality of experience, including 1.8 trillion real-time events per day via 3.3 billion applications streaming on devices in 180 countries. In our State of Streaming Q1 2021 Asia report, we shared details of the status of the streaming industry across Asia. Here is a summary of Eastern Asia, which includes China, Hong Kong, Japan, North Korea, South Korea, Macau, Mongolia, and Taiwan.
Eastern Asia Highlights
Regional growth in viewing time
Overall, time spent streaming in Asia grew by 15% in Q1 2021 versus Q1 of last year. Eastern Asia tallied a moderate growth of 4% year over year.
Regional quality variance
Quality was mixed for Asia in Q1 2021, but Eastern Asia delivered the best overall quality of any region in Q1 2021, only lagging in bitrate which is expected with the smaller percentage of big screen viewing in the region.
Growth in viewing time by content type
Viewers in Asia continued the trend of watching what they want when they want to drive on-demand viewing up 49%, while live streaming fell by 11%. However, Eastern Asia had a 16% decrease in live viewing and a 37% increase in time spent watching on demand. It was the only region where more live content was watched in 2021, a 51% to 49% split.
Share of viewing time by device
While people are streaming more, more and more, they are at home on larger screens. The same held true for Asia, where smart TVs, connected TV devices, and gaming consoles saw the most growth over Q1 of last year. Smart TVs made massive gains with a 335% increase. Connected TV devices also saw triple-digit growth at 147%.
Big screens in Asia vs Global
Big screens have the fastest growth of any device worldwide, including in Asia. But Asia’s device choices when streaming on big screens differ greatly from global patterns. Android TV dominated viewing in Asia with nearly half of all time spent. Amazon Fire TV came in second with 26%, and was followed by Samsung TV at 7%, LG TV at 6%, PlayStation and Chromecast both at 3%, and Apple TV at 2% share in Q1 2021. Roku, a powerhouse in North America, captured a significant 30% share of global big screen viewing time, but it barely made a blip in Asia with just 1% share in Q1.
Sports leagues in Asia on the rebound, for now
Sports leagues in Asia rallied with significant improvements on social media in Q1 2021 as compared to the previous year, when Asia one of the first regions to experience the impacts of COVID-19.
In baseball, the Korea Baseball Organization (KBO) in South Korea showed a 175% increase in video posts and a 60% increase in total engagements compared to Q1 2020.
Nippon Professional Baseball (NPB) in Japan was also able to make a great recovery with 105% more videos posted in Q1 2021 than the year prior with a 29% increase in total engagements.
The unique distribution of social sports audience in Asia
NPB and KBO are both unique in the distribution of their social audience compared to other sports leagues around the world. The NPB was the only league we’ve measured at Conviva in 2021 that had a higher share of audience on YouTube than on Facebook, and the KBO had the largest audience share on YouTube of any sports league we’ve researched at Conviva in 2021, including all American and European leagues.
To get details on all the streaming trends, download Conviva’s State of Streaming Q1 2021: Asia.
Methodology
Data for Conviva’s State of Streaming report was primarily collected from Conviva’s proprietary sensor technology currently embedded in 3.3 billion streaming video applications, measuring in excess of 500 million unique viewers watching 180 billion streams per year with 1.8 trillion real-time transactions per day across more than 180 countries. Year-over-year comparisons were normalized at the customer level for accurate representations of industry growth. The social media data consists of data from over 900 accounts, over 1.8 million posts, 910 thousand videos, 6 billion video views, and over 35 billion engagements across Facebook, Instagram, TikTok, Twitter, and YouTube.


