

 Conviva Leadership

Blog Blog

CTOs and operational teams are facing two critical challenges: 1) high analytics and observability spend with low return on investment (or without the expected impact) and 2) low operational efficiency due to disconnected decision-making.
Traditional observability solutions used by Ops teams fail to capture the actual user experience, leading to costly and inefficient operations. Product teams are looking at Product Analytics solutions which are not operational and focus mainly in user engagement over wide timeframes. Data teams are often pulling data from both into data warehouses and trying to get to actionable insights towards business outcomes. This is expensive, slow, and not democratized across the business.
One of the drivers of high cost is the complexity of the ecosystem, which creates the need to analyze the data by a large number of dimensions – thousands of servers and services (1st and 3rd party), hundreds of thousands of delivery combinations including device models, operating system versions, app versions, ISPs, locations, and more. Actionability depends on finding and prioritizing the improvements which have the higher benefit for the higher number of users.
To address these challenges, Conviva has built a unified Operational Data Platform (ODP) integrating Time-State Analytics and Explainable AI-powered anomaly detection. Time-State Analytics is a technology that enables Conviva’s ODP to compute Stateful QoE and Engagement (stateful) metrics from real-time event streams, at scale and at a 10X lower cost and higher speed than state of the art alternatives such as Flink+Clickhouse. Explainable AI enables our ODP to scan millions of metadata cohorts and pin point anomalies with granular root cause. All of this functionality is designed to get operational teams to act faster and make decisions based on their users’ Quality of Experience.
On top of the ODP, Conviva has built ECO (Experience Centric Observability). By measuring and seamlessly connecting user Quality of Experience (QoE) and System Performance, ECO can pin point the root cause of issues down to the impacted cohort (e.g iOS users running iOS version 11 and app version 2.3) and the actual API or server side endpoint causing the issue. With ECO, Product and Engineering teams can set KPIs that move the needle for the business and work on continuous improvement of those KPIs over time. Ops and Support Teams can react to sudden issues in real-time. With ECO, Product, Engineering, Ops, Support, and Data Science teams now all speak the same language, supercharging operational efficiency with faster, informed decision making.


The Activation layer of the Operational Data Platform enables users to define their own stateful experience metrics and map only the most relevant user events needed to power those metrics. Our sensor executes semantic-less collection of events, making integration much simpler than other solutions.
-
- Semantic Mapper: Map only the events you need to build Stateful Metrics that will represent actual user experience. We sample to show all the events that we are collecting but you will control which events and metrics are computed for 100% of the users. This means you can control costs while having total user counts and total count of impacted users to support Customer Care use cases where specific user IDs are being analyzed, as well as some Product Analytics use cases.
-
- Metric Builder: Define your own Stateful Metrics that represent the critical experiences of users throughout the app. Understand, for example, the login experience, subscription experience, payment experience, time to first play, search experience, app sessions without video, etc. This method of metric generation is also effective for video playback use cases like audio language changes causing buffering or errors, a breakdown of Video Start-Up Time into DRM component, manifest load time, and more.
Example of a Real-Time anomaly detection use-case with ECO
1. The image below shows a proactive real-time AI Alert received via webhook or email or other notification channel, already indicating the actual user experience (represented by a user defined stateful metric) that was impacted. You can see the impacted cohort (Paris24 Web App on login page) and the number of impacted users (this number will grow in real-time during the alert – the example below is an ended alert so 1.95K is the final number). Again, even more important than the workflow which follows is the ability to compute Stateful Metrics that represent actual user experience, in real-time, at scale and cost efficiently.

2. Drilling Down to Alert Details to confirm the issue and further investigate if needed.
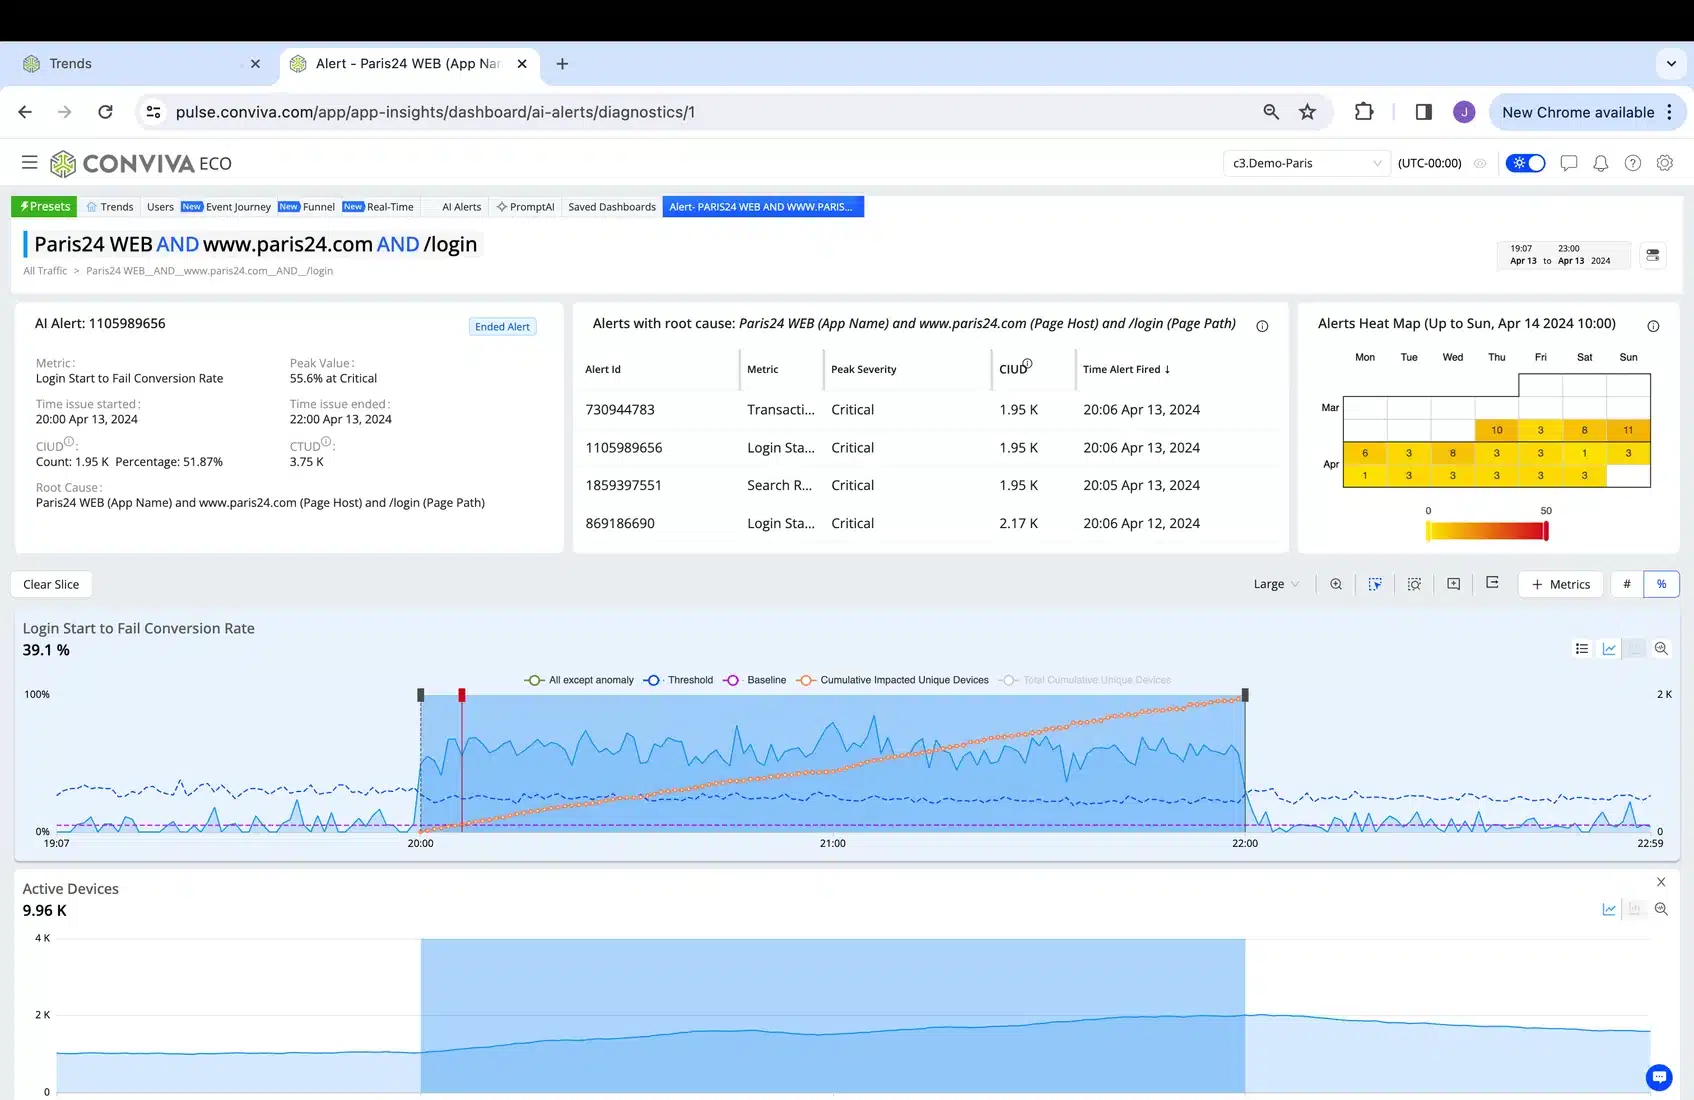
Note the automatic markers where issue started as info (grey) and became a critical (red) as it exceeded a certain number of impacted users.
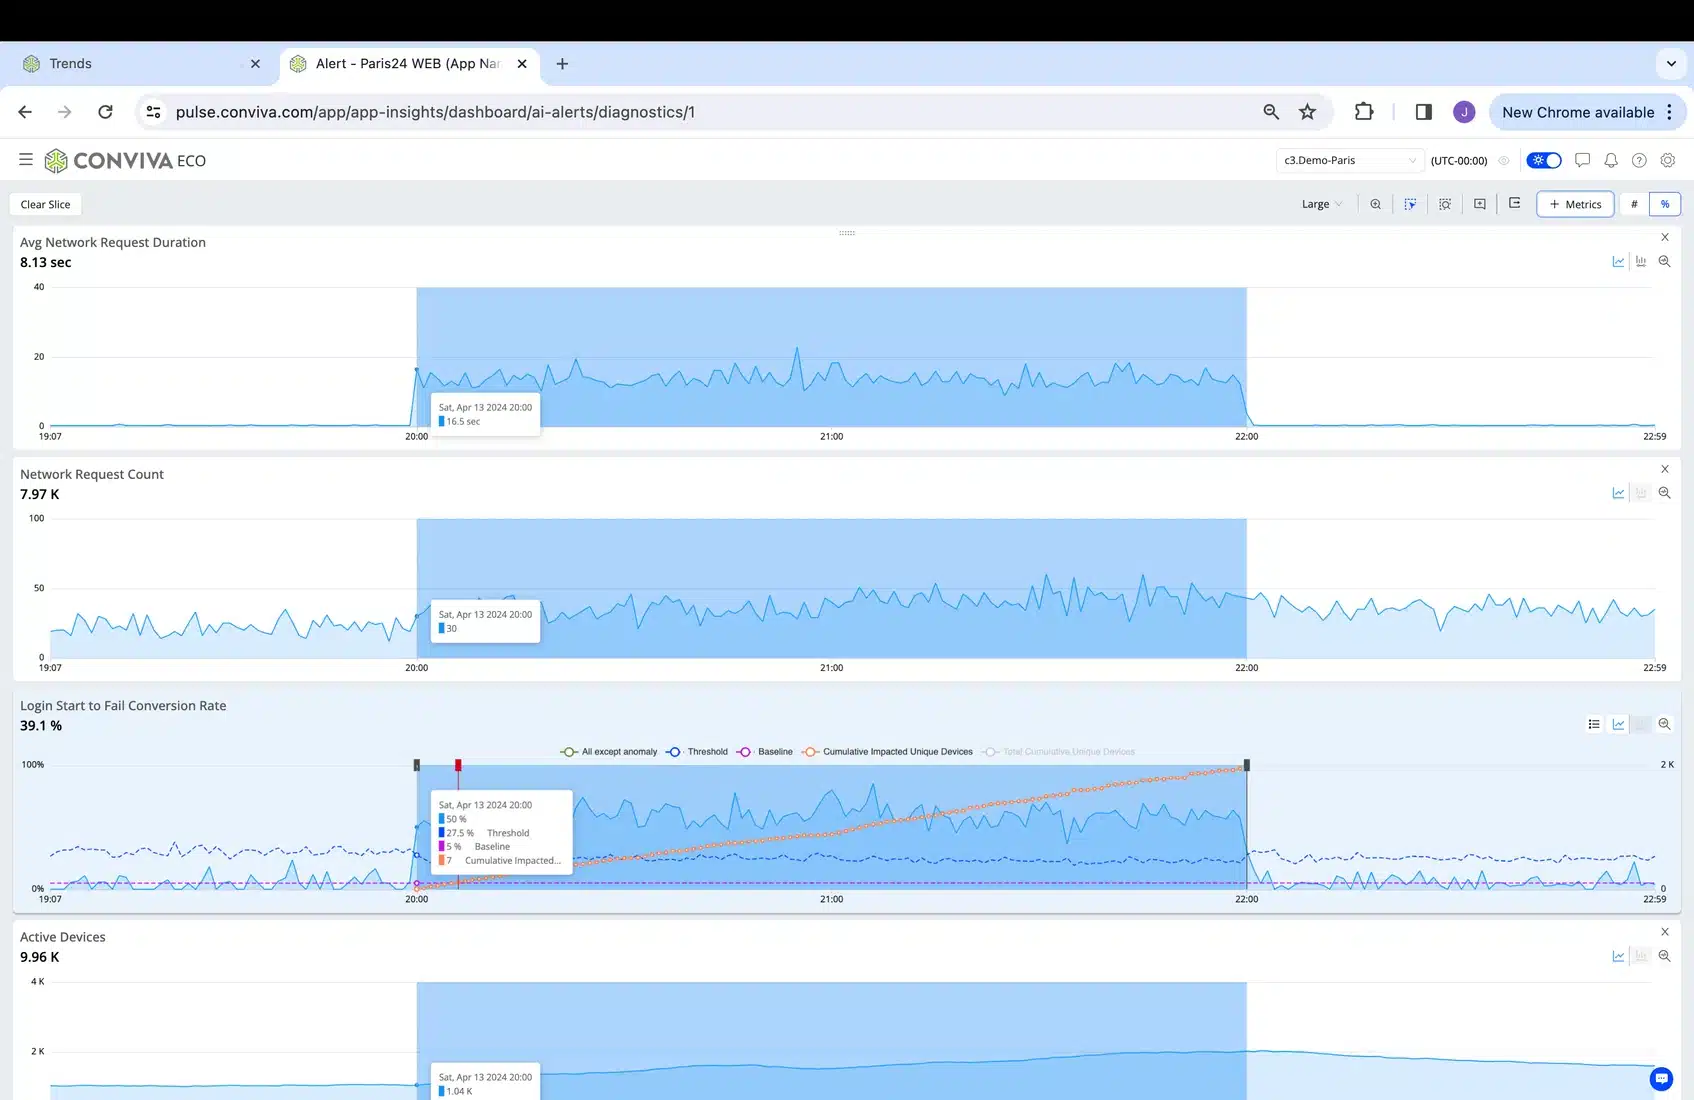
3. Adding QoS metrics (NW request duration and count) to check for QoS issues impacting the QoE metric.
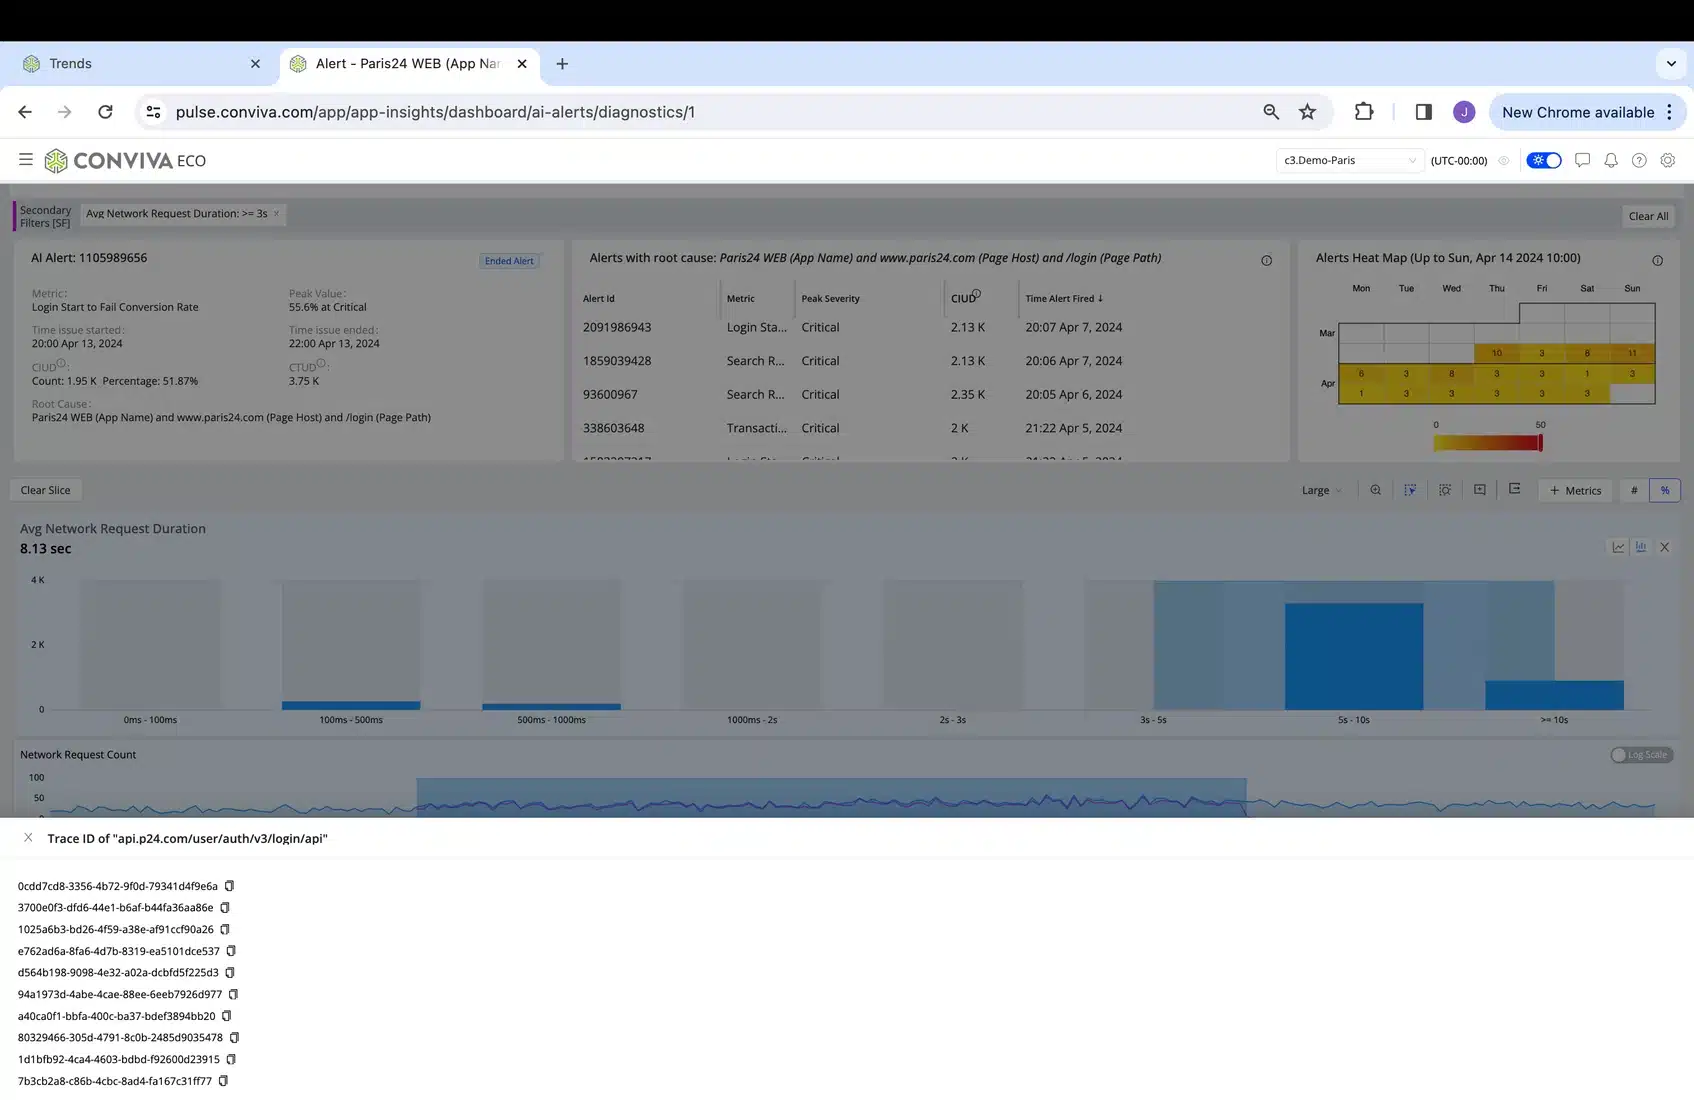
4. As we can see the spike in NW request duration corresponding to the issue, we can use the metric distribution to see how many NW requests with very high duration and select them (just slice with the cursor) to run an Automatic Root Cause Analysis that will return the API or APIs that are likely to be causing the issue (automatically evaluating NW request metadata host, path, query, response codes, etc.):

In this case there is a single API causing the impact. If other APIs had high probability of being related, they would also display (sorted by the more likely culprit).
5. Clicking “Show Trace ID icon” shows the Trace IDs of the NW impacted requests, which gives DevOps teams the data they need to immediately inspect respective backend telemetry, saving many hours of troubleshooting.
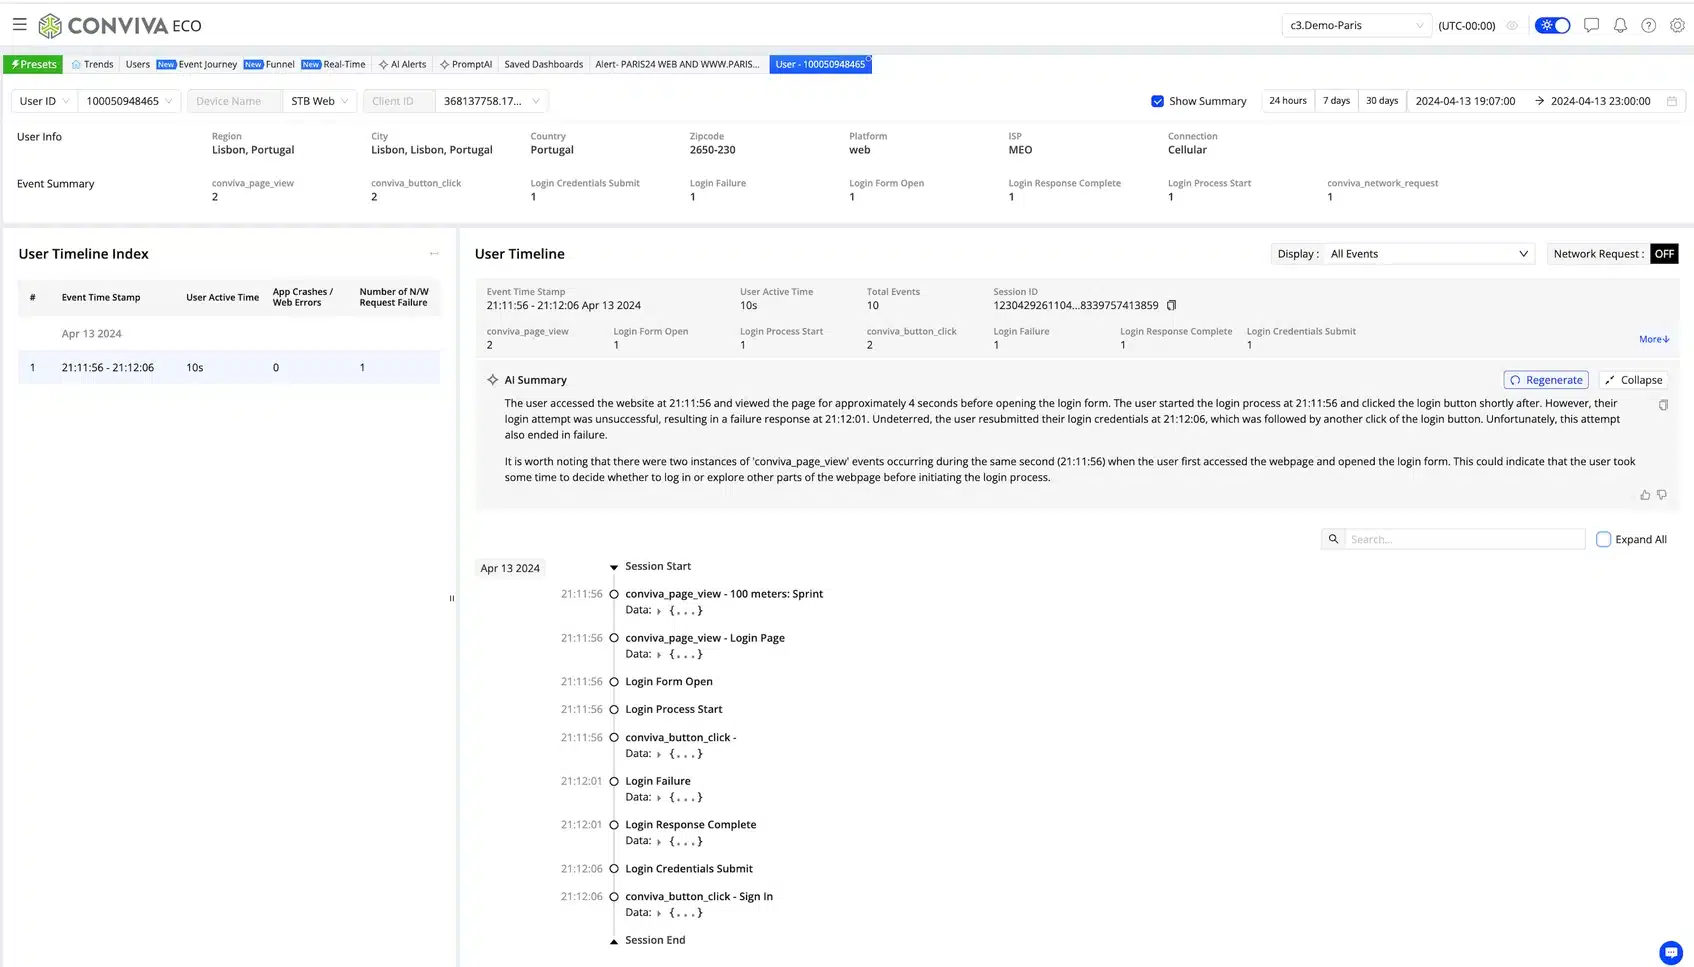
A highly interactive analytics UI (Trends) allows users to drill down into any combination of metrics and metadata and toggle from aggregated metrics to respective contributing user sessions and session timelines. We also include an AI Summary to speed up analysis, as there are typically too many events to review manually:
Conclusion
Conviva Operational Data Platform is designed to address the rising costs of analytics tools by cutting through the noise, surfacing the most critical improvements that will directly improve user experience and increase revenue generation. With ECO, different Teams share a common language and make connected decision, speeding up decision making, boosting actionability and operational efficiency.


