Streaming video tech stacks have continuously increased in complexity as publishers scale their businesses, which has led to over 100 million points of potential failure that result in degraded video quality for viewers. The lift to ensure that content and ads are delivered flawlessly keeps getting heavier. It’s not humanly possible to manually monitor for all the potential issues. Network operations center (NOC) teams work tirelessly to ensure that video streams run without interruption for viewers by closely tracking data and intervening quickly when an issue arises.
Today, for NOC teams to do their jobs well, they require reliable, real-time quality of experience (QoE) data to make quick decisions, the ability easily to identify issues, and robust tools for rapid diagnostics and intervention to minimize issue impact. These needs are best met by leveraging artificial intelligence (AI) and automation, utilizing intuitive and visual cues to draw attention to data anomalies, and providing the flexibility to monitor what matters in the moment.
Less Work, Better Results
The metric threshold that indicates an issue can vary based on devices, content types, streaming protocols, internet service providers, geography, and more. The only way to manage a business that monitors each of these variables is to leverage enhanced automation for issue detection. Conviva solves for enhanced monitoring with an AI algorithm that continuously scans data for anomalies, getting to know how a network generally performs to set self-adjusting thresholds for every variable to rapidly identify anomalies. This takes the manual work out of identifying thresholds for all the different metrics being monitored in live and video-on-demand streams, and allows for faster detections in changes to data, ultimately resulting in expedited interventions and mitigating large scale outages.
Don’t Miss a Thing by Paying Attention to What Matters
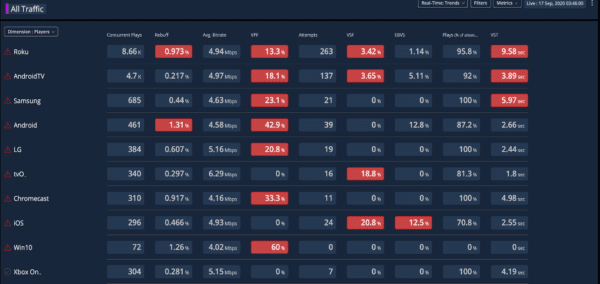
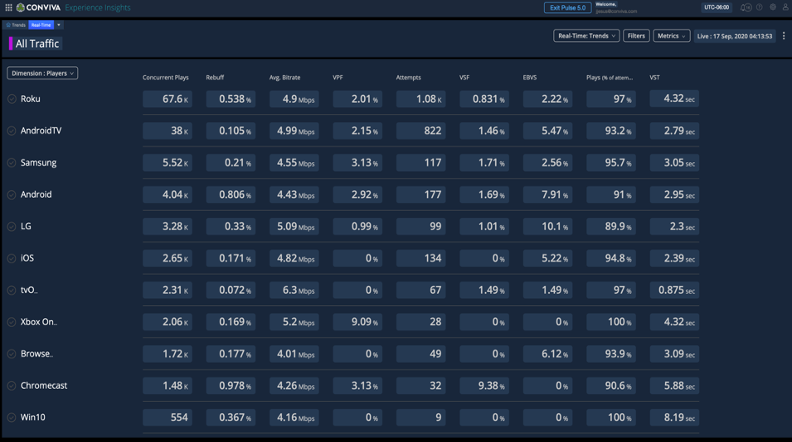
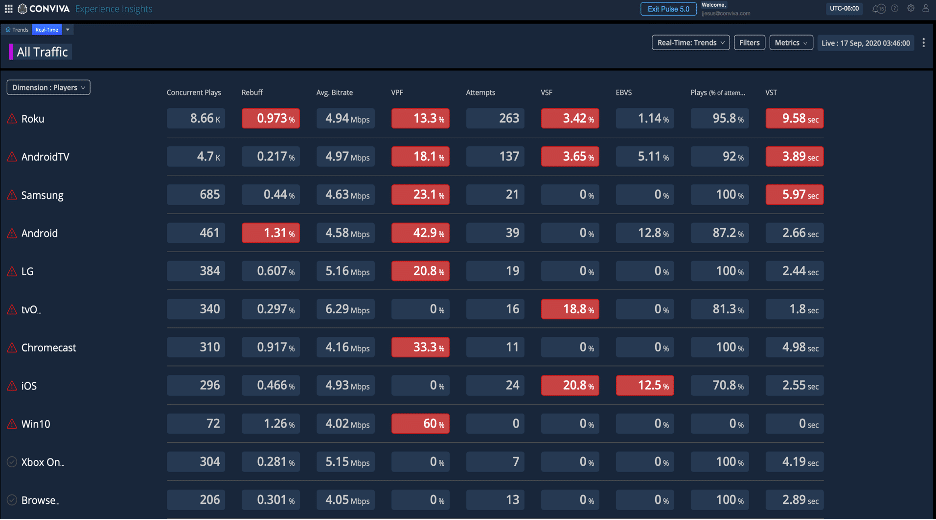
NOC teams sitting in dark rooms, watching screens filled with data, need to focus hard to make sure they don’t miss anything. For this reason, Conviva included visual alerts in the newest version of Real-Time Dashboards. Visual alerts help users easily observe which QoE data needs to be investigated by changing colors and bubbling the metric tile up to the top. With a connected workflow into Conviva’s Pulse 5 Trends Tab, users can easily dig into performance and pinpoint the root cause of issues. Additionally, Real-Time Dashboards provide display options for light and dark mode so that users can pick the view that works best for them.
Flexible and Sharable
“When we spend time working with our dashboards, we find that static dashboards are really, really limiting, they really don’t let you get down to the root cause. No matter how good you thought the dashboard was going to be before you go into the situation, there’s always some other factor or dimension you’re going to have to go tweak it or fiddle with it. With Conviva…[Real-Time Dashboards] lets you do a great job…you drill down and continually add filters to get to the root cause.”
— Bryce Fisher-Fleig, CBS Lead Video Software Engineer
It’s impossible to predict where an issue may occur, and having a dashboard that’s easy to configure is important for responding to any issue that can pop up. Conviva’s dashboards are easily configured by setting dimensions or filters to monitor different geographies, channels or platforms or metrics. Users can apply filters from Trends straight to Real-Time Dashboards with the click of a button. Further, users can share dashboard configurations with teammates or save them as their default view.
Poor video quality interrupts an engaged user experience: buffering during a show could frustrate a user and cause them to leave a stream, interruptions during an ad break could result in lost monetization opportunities. As such, Conviva is committed to building products that allow video QoE data to be more transparent and actionable, so publishers can focus on providing viewers with delightful and engaging video experiences, whether it’s a weekend binge of the newest drama or the finals of their favorite sport.
Dark mode dashboard – choose a dimension like player to monitor performance:

Visual alerts call out detected issues, connected workflow allows user to click through to the Trends dashboard to investigate:

Learn more about Conviva’s Experience Intelligence.


